BNZ – BusinessNZ
Performance of
Services Index

Upwards momentum – PSI

20 Jun, 2022
55.2
May
+3.0

Monthly Change

expanding
faster rate

Activity levels in New Zealand’s services sector displayed upwards momentum during May, according to the BNZ – BusinessNZ Performance of Services Index (PSI).

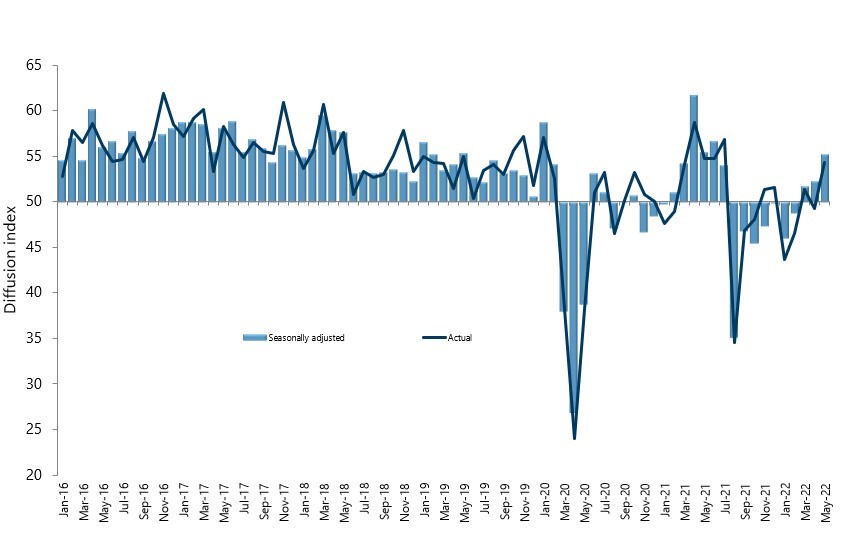
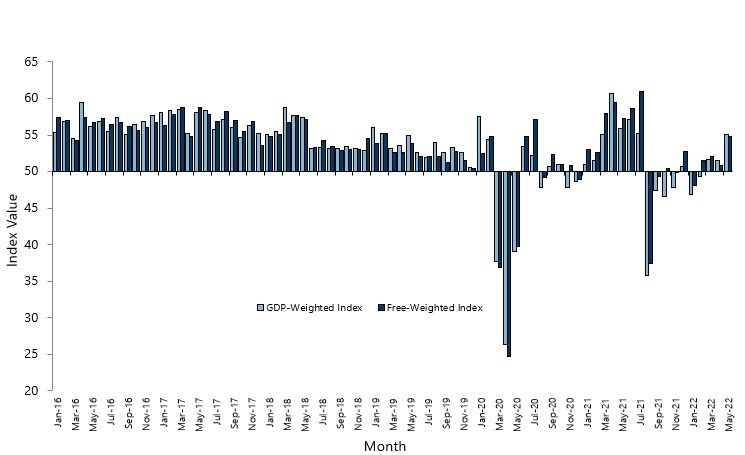
The PSI for May was 55.2 (A PSI reading above 50.0 indicates that the service sector is generally expanding; below 50.0 that it is declining).  This was up 3 points from April, and above the long-term average of 53.6 for the survey.

BusinessNZ chief executive Kirk Hope said that the May result represented the highest monthly result since June 2021, and the fourth consecutive time showing increased activity from the previous month.  Obviously, any rush to conclude the sector is now firmly back on track needs to be tempered with the fact that there are still a number of potential headwinds coming, both domestically and internationally.

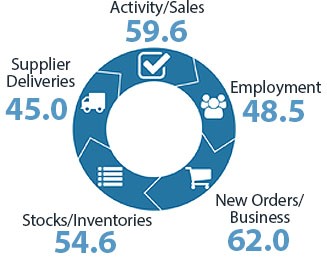
“The two key sub-indexes of New Orders/Business (62.0) and Activity/Sales (59.6) both experienced a healthy pick-up in activity to lead the way in overall expansion.  While Employment (48.5) went back into contraction during May, Supplier Deliveries (45.0) recovered somewhat from earlier lows.”  

With the pick-up in expansion, the proportion of negative and positive comments were exactly even for May, compared with 61.9% of negative comments in April.

BNZ Senior Economist Doug Steel said that “while the improvement was far from universal across components, reflecting many ongoing challenges across segments of the service sector, the overall outcome was the first above average result since the outbreak of Delta in August last year.”

Kirk Hope

Kirk Hope

CEO, BusinessNZ

BNZ - BusinessNZ PSI

Time Series Data

View seasonally adjusted and unadjusted time series data for the BNZ - BusinessNZ PSI

Services Landscape

PSI heads higher

After a somewhat disappointing April result in the context of easing COVID restrictions during that month (Red to Orange), the Performance of Services Index (PSI) made a more strident step forward in May.
Read more

Demand indicators firm

Demand components led the charge in May. New orders/business rose to an outright strong 62.0 from a soso reading of 55.2 in April. Activity/sales also rose strongly to 59.6, to be well above its long term average of 54.8.
Read more

Headway or Headfake?

It remains to be seen how durable the bounce in the PSI turns out to be. But along with last week’s solid PMI reading, a lift in the combined index (PCI) adds weight to our long-held view that GDP will bounce strongly in Q2 following its weakness in Q1.
Read more

Supply issues remain, although more mixed

Supplier deliveries remain an issue, with this component still languishing below the 50 mark as it has done since shortly after the pandemic started.
Read more

Doug Steel

Doug Steel

Senior Economist, BNZ

Sponsor Statement

BNZ is delighted to be associated with the Performance of Services Index (PSI) and BusinessNZ.

This association brings together the significant experience of leading business advocacy body BusinessNZ, and business finance specialist BNZ.

We look forward to continuing our association with BusinessNZ and associated regional organisations, and to playing our part in the ongoing development of the New Zealand service sector.

PSI Time Series Table

The results are seasonally adjusted.

National Indicies May
2021
Jan
2022
Feb
2022
Mar
2022
Apr
2022
May
2022
BNZ – BusinessNZ PSI 55.5 46.1 48.8 51.7 52.2 55.2
Activity/Sales 57.1 44.2 50.8 53.7 53.3 59.6
Employment 55.3 47.8 44.5 49.1 51.0 48.5
New Orders/Business 61.0 40.5 54.6 59.2 55.2 62.0
Stocks/Inventories 50.2 48.6 50.7 52.9 55.0 54.6
Supplier Deliveries 43.9 44.0 33.7 41.1 40.7 45.0

BNZ – BusinessNZ PSI Time Series

May 2018 – May 2022

International Results

J.P. Morgan Global Manufacturing PSITM

06 Jun 2022
52.2

About the PSI

The BNZ – BusinessNZ Performance of Services Index is a monthly survey of the service sector providing an early indicator of activity levels.

A PSI reading above 50 points indicates service activity is expanding; below 50 indicates it is contracting.

The main PSI and sub-index results are seasonally adjusted.

Technical Contact

Stephen Summers
Economist, BusinessNZ

[email protected]

PSI Releases

Lost momentum

New Zealand’s services sector fell back into contraction during March, according to the BNZ – BusinessNZ Performance of Services Index (PSI). The PSI for March was 47.5 (A PSI reading above 50.0 indicates that the service sector is generally expanding; below 50.0 that...

Path of expansion

New Zealand’s services sector continued its path of expansion in February, according to the BNZ – BusinessNZ Performance of Services Index (PSI). The PSI for February was 53.0 (A PSI reading above 50.0 indicates that the service sector is generally expanding; below...

Green shoots?

New Zealand’s services sector climbed back into expansion for the start of 2024, according to the BNZ – BusinessNZ Performance of Services Index (PSI). The PSI for January was 52.1 (A PSI reading above 50.0 indicates that the service sector is generally expanding;...

Activity on holiday

New Zealand’s services sector fell back into contraction during December, according to the BNZ – BusinessNZ Performance of Services Index (PSI). The PSI for December was 48.8 (A PSI reading above 50.0 indicates that the service sector is generally expanding; below...

Over the line

New Zealand’s services sector recorded expansion in November, according to the BNZ – BusinessNZ Performance of Services Index (PSI). The PSI for November was 51.2 (A PSI reading above 50.0 indicates that the service sector is generally expanding; below 50.0 that it is...

BNZ – BusinessNZ
Performance of
Composite Index

55.0

GDP-Weighted Index

54.8

Free-Weighted Index

The seasonally adjusted BNZ – BusinessNZ Performance of Composite Index or PCI (which combines the PMI and PSI) saw both options for measuring the May PCI improve in expansion.

The May GDP-Weighted Index (55.0) increased 3.5 points from April, while the Free-Weighted Index (54.8) rose 3.9 points.

PCI Time Series Table

The results are seasonally adjusted.

National Indices May
2021
Jan
2022
Feb
2022
Mar
2022
Apr
2022
May
2022
GDP-Weighted Index 55.9 46.9 49.4 51.6 51.5 55.0
Free-Weighted Index 57.3 48.1 51.6 52.0 50.9 54.8

BNZ – BusinessNZ PCI Time Series

May 2018 – May 2022

About the PCI

The BNZ – BusinessNZ Performance of Composite Index (PCI) takes into account results from both the Performance of Manufacturing Index (PMI) and the Performance of Services Index (PSI). Combined results are shown in two ways:

GDP-Weighted Index:
Apportions the weight of the manufacturing and services index within the economy to produce an overall result.

Free-Weighted Index:
Combines data from both indexes to produce an overall result.

Both time series for the PCI are then seasonally adjusted.

BNZ - BusinessNZ PCI

Time Series Data

View seasonally adjusted and unadjusted time series data for the BNZ - BusinessNZ PCI

Our Contributors

The BNZ – BusinessNZ PSI contains data obtained through BusinessNZ’s regional organisations