BNZ – BusinessNZ
Performance of
Services Index

Uplift – PSI

19 Sep, 2022
58.6
August
+4.2

Monthly Change

expanding
faster rate

Expansion levels for New Zealand’s services sector saw a sizeable uplift in August, according to the BNZ – BusinessNZ Performance of Services Index (PSI).

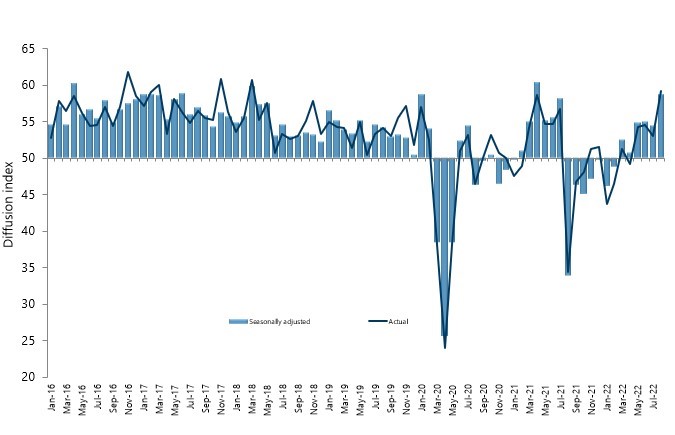
The PSI for August was 58.6 (A PSI reading above 50.0 indicates that the service sector is generally expanding; below 50.0 that it is declining).  This was up 4.2 points from July, and the highest level of activity since April 2021.  It was also above the long-term average of 53.6 for the survey.

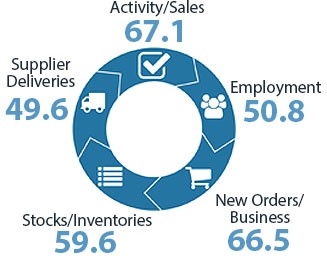
BusinessNZ chief executive Kirk Hope said that the August result had a number of different aspects to it that led to a substantial level of overall activity.  The two key sub-indexes of New Activity/Sales (67.1) and Orders/Business (66.5) both displayed significant gains, while stocks/inventories (59.6) were at its highest level since November 2019.  Although Employment (50.8) remained somewhat lacklustre and Supplier Deliveries (49.6) remained in contraction, the positive position of the other sub-index values was more than enough to push the national result higher.

In line with the improved main figure, the proportion of positive comments for August (56.3%) came out on top, compared with negative comments in July (58.2%) and June (59%) dominating.

BNZ Senior Economist Doug Steel said that “overall, combining August’s strong PSI with last week’s firmer PMI yields a composite index (PCI) that suggests annual GDP growth up toward 5% in Q3 2022.  We currently forecast 5%+ for that period but that strength is mostly a function of the very weak base period. If the PCI is truly bouncing, the key question is for how long?”

Kirk Hope

Kirk Hope

CEO, BusinessNZ

BNZ - BusinessNZ PSI

Time Series Data

View seasonally adjusted and unadjusted time series data for the BNZ - BusinessNZ PSI

Services Landscape

Full service

The Performance of Services Index (PSI) roared ahead in August, up to 58.6. It’s a significant step up from July’s 54.4 and even more so from July’s initial reading of 51.2 before it was subsequently revised higher.

Read more

Signal or noise?

The PSI volatility is not out of line with many other economic indicators as normal seasonal patterns are thrown around by the likes of changing Covid settings, absenteeism, and reopening of the border.

Read more

Demand and Supply

August’s PSI was driven higher by surging activity/sales and new orders/business. The 67.1 activity/sales reading is within a whisker of an all-time high. Along with the very strong 66.5 new orders index, it points to strong demand.

Read more

Doug Steel

Doug Steel

Senior Economist, BNZ

Sponsor Statement

BNZ is delighted to be associated with the Performance of Services Index (PSI) and BusinessNZ.

This association brings together the significant experience of leading business advocacy body BusinessNZ, and business finance specialist BNZ.

We look forward to continuing our association with BusinessNZ and associated regional organisations, and to playing our part in the ongoing development of the New Zealand service sector.

PSI Time Series Table

The results are seasonally adjusted.

National Indicies Aug 2021 Apr 2022 May 2022 Jun 2022 Jul 2022 Aug 2022
BNZ – BusinessNZ PSI 34.1 50.8 54.9 54.9 54.4 58.6
Activity/Sales 24.8 53.0 59.2 55.8 54.5 67.1
Employment 49.3 51.2 48.8 52.7 49.3 50.8
New Orders/Business 31.1 54.0 61.9 61.2 53.4 66.5
Stocks/Inventories 46.5 55.2 54.8 54.2 53.7 59.6
Supplier Deliveries 25.6 41.7 45.9 48.9 47.6 49.6

BNZ – BusinessNZ PSI Time Series

January 2016 – August 2022

International Results

J.P. Morgan Global Manufacturing PSITM

06 Sep 2022
49.2

About the PSI

The BNZ – BusinessNZ Performance of Services Index is a monthly survey of the service sector providing an early indicator of activity levels.

A PSI reading above 50 points indicates service activity is expanding; below 50 indicates it is contracting.

The main PSI and sub-index results are seasonally adjusted.

Technical Contact

Stephen Summers
Economist, BusinessNZ

[email protected]

PSI Releases

Lost momentum

New Zealand’s services sector fell back into contraction during March, according to the BNZ – BusinessNZ Performance of Services Index (PSI). The PSI for March was 47.5 (A PSI reading above 50.0 indicates that the service sector is generally expanding; below 50.0 that...

Path of expansion

New Zealand’s services sector continued its path of expansion in February, according to the BNZ – BusinessNZ Performance of Services Index (PSI). The PSI for February was 53.0 (A PSI reading above 50.0 indicates that the service sector is generally expanding; below...

Green shoots?

New Zealand’s services sector climbed back into expansion for the start of 2024, according to the BNZ – BusinessNZ Performance of Services Index (PSI). The PSI for January was 52.1 (A PSI reading above 50.0 indicates that the service sector is generally expanding;...

Activity on holiday

New Zealand’s services sector fell back into contraction during December, according to the BNZ – BusinessNZ Performance of Services Index (PSI). The PSI for December was 48.8 (A PSI reading above 50.0 indicates that the service sector is generally expanding; below...

Over the line

New Zealand’s services sector recorded expansion in November, according to the BNZ – BusinessNZ Performance of Services Index (PSI). The PSI for November was 51.2 (A PSI reading above 50.0 indicates that the service sector is generally expanding; below 50.0 that it is...

BNZ – BusinessNZ
Performance of
Composite Index

58.2

GDP-Weighted Index

57.9

Free-Weighted Index

The seasonally adjusted BNZ – BusinessNZ Performance of Composite Index or PCI (which combines the PMI and PSI) saw the two options for measuring the PCI both improve in August.

The August GDP-Weighted Index (58.2) increased 3.9 points from July, while the Free-Weighted Index (57.9) rose 3.6 points.

PCI Time Series Table

The results are seasonally adjusted.

National Indices Aug 2021 Apr 2022 May 2022 Jun 2022 Jul 2022 Aug 2022
GDP-Weighted Index 34.8 50.2 54.7 54.3 54.3 58.2
Free-Weighted Index 37.2 50.8 54.5 52.4 54.3 57.9

BNZ – BusinessNZ PCI Time Series

January 2016 – August 2022

About the PCI

The BNZ – BusinessNZ Performance of Composite Index (PCI) takes into account results from both the Performance of Manufacturing Index (PMI) and the Performance of Services Index (PSI). Combined results are shown in two ways:

GDP-Weighted Index:
Apportions the weight of the manufacturing and services index within the economy to produce an overall result.

Free-Weighted Index:
Combines data from both indexes to produce an overall result.

Both time series for the PCI are then seasonally adjusted.

BNZ - BusinessNZ PCI

Time Series Data

View seasonally adjusted and unadjusted time series data for the BNZ - BusinessNZ PCI

Our Contributors

The BNZ – BusinessNZ PSI contains data obtained through BusinessNZ’s regional organisations