BNZ – BusinessNZ
Performance of
Services Index

Evening out – PSI

16 May, 2022
51.4
April
-0.1

Monthly Change

expanding
slower rate

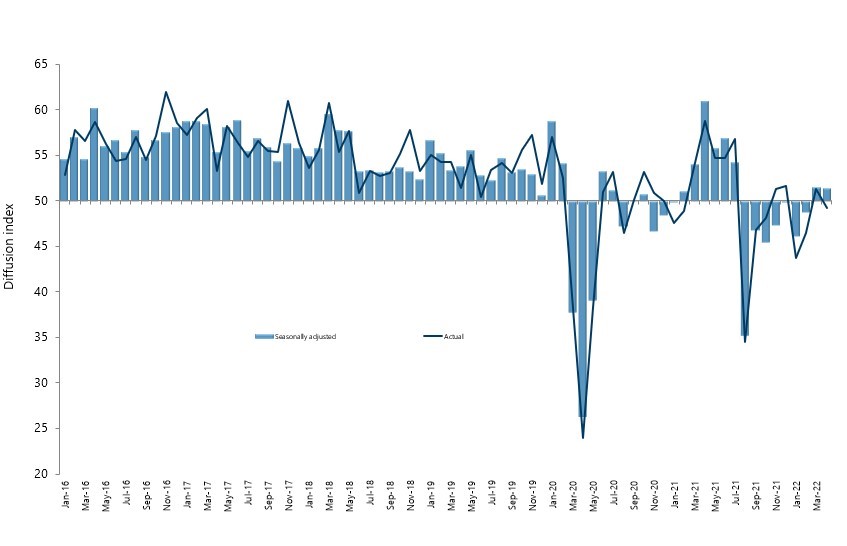
Activity levels in New Zealand’s services sector during April were almost identical to March, according to the BNZ – BusinessNZ Performance of Services Index (PSI).

The PSI for April was 51.4 (A PSI reading above 50.0 indicates that the service sector is generally expanding; below 50.0 that it is declining).  This was down 0.1 points from March, and still below the long-term average of 53.6 for the survey.

BusinessNZ chief executive Kirk Hope said that while the April result remained in positive territory, the fickle nature of some of the key sub-index values means a consistent trend towards expansion at traditional levels still seems some way off.

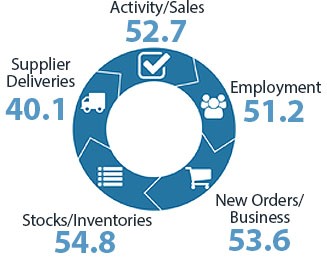
“The two key sub-indexes of New Orders/Business (53.6) and Activity/Sales (52.7) both experienced a drop in expansion levels for April.  While Employment (51.2) saw its first expansionary result since November 2021, Supplier Deliveries (40.1) remains entrenched in contraction.

Despite a similar overall result to the previous month, the proportion of negative comments increased from 57.5% in March to 61.9% in April.

BNZ Senior Economist Doug Steel said that “for large parts of the service sector that have been through the ringer over recent times, we suspect any result above breakeven would be welcomed. But, on the other hand, April’s result also looks somewhat disappointing in the context of easing COVID restrictions (from Red to Orange) halfway through the month.”

Kirk Hope

Kirk Hope

CEO, BusinessNZ

BNZ - BusinessNZ PSI

Time Series Data

View seasonally adjusted and unadjusted time series data for the BNZ - BusinessNZ PSI

Services Landscape

PSI

The Performance of Services Index was 51.4 in April, so little changed from March’s 51.5. On the one hand, this result could be viewed as positive with it being above the breakeven 50 mark for a second consecutive month.
Read more

Some relief, but

To be sure, some parts of the PSI did lift strongly in April. Cultural, Recreational, and Personal stood out among industries, with its unadjusted PSI leaping from a truly dismal 15.6 in March to a record high of 85.8 in April, aided by a reboot of travel and events.
Read more

Stark differences

Looking across regions, Otago/Southland’s PSI rose to a strong unadjusted 59.9 in April after a long period of underperformance. Some border reopening, and more promised, has seemingly boosted activity in the deep South by more than elsewhere.
Read more

Supply remains short

Supply chain issues remain a major headache for service sector firms – epitomised by the PSI supplier deliveries index still languishing around 40, more than 10 full index points below its historical average.
Read more

Doug Steel

Doug Steel

Senior Economist, BNZ

Sponsor Statement

BNZ is delighted to be associated with the Performance of Services Index (PSI) and BusinessNZ.

This association brings together the significant experience of leading business advocacy body BusinessNZ, and business finance specialist BNZ.

We look forward to continuing our association with BusinessNZ and associated regional organisations, and to playing our part in the ongoing development of the New Zealand service sector.

PSI Time Series Table

The results are seasonally adjusted.

National Indicies Apr
2021
Dec
2021
Jan
2022
Feb
2022
Mar
2022
Apr
2022
BNZ – BusinessNZ PSI 60.9 49.9 46.1 48.8 51.5 51.4
Activity/Sales 62.4 51.0 44.6 50.8 53.5 52.7
Employment 60.5 49.4 47.8 44.5 49.2 51.2
New Orders/Business 68.3 52.2 40.7 54.4 59.0 53.6
Stocks/Inventories 56.5 51.3 48.5 50.6 52.8 54.8
Supplier Deliveries 46.5 49.6 43.7 34.0 40.5 40.1

BNZ – BusinessNZ PSI Time Series

January 2016 - April 2022

International Results

J.P. Morgan Global Manufacturing PSITM

05 May 2022
51.9

About the PSI

The BNZ – BusinessNZ Performance of Services Index is a monthly survey of the service sector providing an early indicator of activity levels.

A PSI reading above 50 points indicates service activity is expanding; below 50 indicates it is contracting.

The main PSI and sub-index results are seasonally adjusted.

Technical Contact

Stephen Summers
Economist, BusinessNZ

[email protected]

PSI Releases

Lost momentum

New Zealand’s services sector fell back into contraction during March, according to the BNZ – BusinessNZ Performance of Services Index (PSI). The PSI for March was 47.5 (A PSI reading above 50.0 indicates that the service sector is generally expanding; below 50.0 that...

Path of expansion

New Zealand’s services sector continued its path of expansion in February, according to the BNZ – BusinessNZ Performance of Services Index (PSI). The PSI for February was 53.0 (A PSI reading above 50.0 indicates that the service sector is generally expanding; below...

Green shoots?

New Zealand’s services sector climbed back into expansion for the start of 2024, according to the BNZ – BusinessNZ Performance of Services Index (PSI). The PSI for January was 52.1 (A PSI reading above 50.0 indicates that the service sector is generally expanding;...

Activity on holiday

New Zealand’s services sector fell back into contraction during December, according to the BNZ – BusinessNZ Performance of Services Index (PSI). The PSI for December was 48.8 (A PSI reading above 50.0 indicates that the service sector is generally expanding; below...

Over the line

New Zealand’s services sector recorded expansion in November, according to the BNZ – BusinessNZ Performance of Services Index (PSI). The PSI for November was 51.2 (A PSI reading above 50.0 indicates that the service sector is generally expanding; below 50.0 that it is...

BNZ – BusinessNZ
Performance of
Composite Index

50.6

GDP-Weighted Index

50.6

Free-Weighted Index

The seasonally adjusted BNZ – BusinessNZ Performance of Composite Index or PCI (which combines the PMI and PSI) saw both options for measuring the April PCI remain in expansion, although both down from March.

The April GDP-Weighted Index (50.6) decreased 0.8 points from March, while the Free-Weighted Index (50.6) fell 1.6 points.

PCI Time Series Table

The results are seasonally adjusted.

National Indices Apr
2021
Dec
2021
Jan
2022
Feb
2022
Mar
2022
Apr
2022
GDP-Weighted Index 59.9 50.7 47.0 49.4 51.4 50.6
Free-Weighted Index 59.2 52.8 47.9 51.5 52.2 50.6

BNZ – BusinessNZ PCI Time Series

January 2016 - April 2022

About the PCI

The BNZ – BusinessNZ Performance of Composite Index (PCI) takes into account results from both the Performance of Manufacturing Index (PMI) and the Performance of Services Index (PSI). Combined results are shown in two ways:

GDP-Weighted Index:
Apportions the weight of the manufacturing and services index within the economy to produce an overall result.

Free-Weighted Index:
Combines data from both indexes to produce an overall result.

Both time series for the PCI are then seasonally adjusted.

BNZ - BusinessNZ PCI

Time Series Data

View seasonally adjusted and unadjusted time series data for the BNZ - BusinessNZ PCI

Our Contributors

The BNZ – BusinessNZ PSI contains data obtained through BusinessNZ’s regional organisations