BNZ – BusinessNZ
Performance of
Services Index

Waiting game – PSI

13 Dec, 2021
46.5
November
+1.6

Monthly Change

contracting
slower rate

Activity levels in New Zealand’s services sector improved slightly during November, although still remained in overall contraction, according to the BNZ – BusinessNZ Performance of Services Index (PSI).

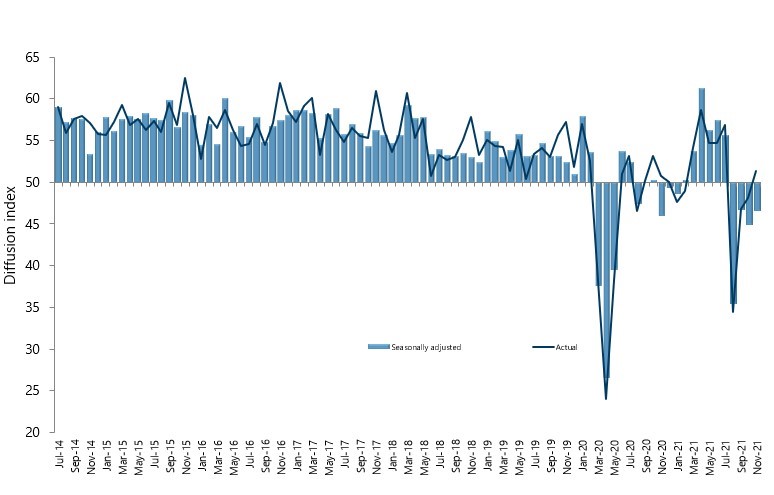
The PSI for November was 46.5 (A PSI reading above 50.0 indicates that the service sector is generally expanding; below 50.0 that it is declining).  This was up 1.6 points from October, and almost identical to the September result.

BusinessNZ chief executive Kirk Hope said that the stagnant nature of recent results exemplifies the difficult trading conditions many businesses currently find themselves in. 

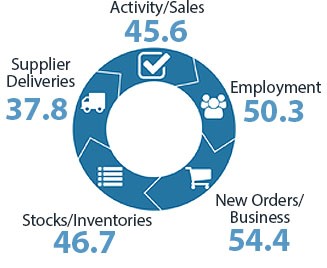
“The key sub-index of Activity/Sales (45.6) remains n contraction, although continues to improve slightly from its low in August.  More encouragingly, New Orders/Business (54.4) returned to expansion for the first time since July, which was likely due to easing of lockdown conditions.  While Employment (50.3) remains close to no change, both Stocks/Inventories (46.7) and Supplier Deliveries (37.8) have yet to show expansion since the 2021 nationwide lockdown.”

BNZ Senior Economist Craig Ebert said that “we can surely expect the PSI, and even the PMI, to improve in December, given New Zealand’s move into the less-restrictive “traffic-light” system of COVID management near the start of the month.  Still, the latest PSI and PMI results warn against taking a strong bounce in GDP for granted, at this point.”

Kirk Hope

Kirk Hope

CEO, BusinessNZ

BNZ - BusinessNZ PSI

Time Series Data

View seasonally adjusted and unadjusted time series data for the BNZ - BusinessNZ PSI

Services Landscape

The PSI

Just like the PMI did, the Performance of Services Index (PSI) disappointed for November. Far from reclaiming an expansive tone – as seemed possible, considering COVID-related restrictions tended to abate in the month – the PSI kept a contractionary tone.
Read more

Not all weak

While the supply-side metrics are no great surprise, other messages from November’s PSI proved curious. For example, for all of Auckland’s travails over recent months – as level 3 restrictions hung around – it was Otago/Southland that reported the weakest regional result, by far, with an unadjusted 33.6 (Northern was at 47.5).
Read more

Implications for GDP

In terms of their signals for GDP, the latest PSI, along with the PMI, counsel caution about the rebound we can expect for Q4.  Yes, it looks as though Q3 GDP might not drop as much as earlier feared (with that result due Thursday). This would put less onus on Q4 GDP to jump, to keep things on plan.
Read more

Global guidance

One of the great unknowns is how the NZ populace handles the virus circulating more widely in the country, under the traffic-light system, and the about-to-be loosened border around Auckland.
Read more

Craig Ebert

Craig Ebert

Senior Economist, BNZ

Sponsor Statement

BNZ is delighted to be associated with the Performance of Services Index (PSI) and BusinessNZ.

This association brings together the significant experience of leading business advocacy body BusinessNZ, and business finance specialist BNZ.

We look forward to continuing our association with BusinessNZ and associated regional organisations, and to playing our part in the ongoing development of the New Zealand service sector.

PSI Time Series Table

The results are seasonally adjusted.

National Indicies Nov
2020
Jul
2021
Aug
2021
Sep
2021
Oct
2021
Nov
2021
BNZ – BusinessNZ PSI 45.9 55.7 35.4 46.6 44.9 46.5
Activity/Sales 44.8 61.3 25.1 43.4 44.4 45.6
Employment 49.2 54.3 49.0 51.4 50.0 50.3
New Orders/Business 52.1 59.2 32.5 47.4 46.3 54.4
Stocks/Inventories 46.9 50.8 47.5 49.7 46.1 46.7
Supplier Deliveries 40.2 45.8 26.4 41.2 36.8 37.8

BNZ – BusinessNZ PSI Time Series

November 2017 – November 2021

International Results

J.P. Morgan Global Manufacturing PSITM

03 Dec 2021
55.6

About the PSI

The BNZ – BusinessNZ Performance of Services Index is a monthly survey of the service sector providing an early indicator of activity levels.

A PSI reading above 50 points indicates service activity is expanding; below 50 indicates it is contracting.

The main PSI and sub-index results are seasonally adjusted.

Technical Contact

Stephen Summers
Economist, BusinessNZ

[email protected]

PSI Releases

Lost momentum

New Zealand’s services sector fell back into contraction during March, according to the BNZ – BusinessNZ Performance of Services Index (PSI). The PSI for March was 47.5 (A PSI reading above 50.0 indicates that the service sector is generally expanding; below 50.0 that...

Path of expansion

New Zealand’s services sector continued its path of expansion in February, according to the BNZ – BusinessNZ Performance of Services Index (PSI). The PSI for February was 53.0 (A PSI reading above 50.0 indicates that the service sector is generally expanding; below...

Green shoots?

New Zealand’s services sector climbed back into expansion for the start of 2024, according to the BNZ – BusinessNZ Performance of Services Index (PSI). The PSI for January was 52.1 (A PSI reading above 50.0 indicates that the service sector is generally expanding;...

Activity on holiday

New Zealand’s services sector fell back into contraction during December, according to the BNZ – BusinessNZ Performance of Services Index (PSI). The PSI for December was 48.8 (A PSI reading above 50.0 indicates that the service sector is generally expanding; below...

Over the line

New Zealand’s services sector recorded expansion in November, according to the BNZ – BusinessNZ Performance of Services Index (PSI). The PSI for November was 51.2 (A PSI reading above 50.0 indicates that the service sector is generally expanding; below 50.0 that it is...

BNZ – BusinessNZ
Performance of
Composite Index

47.0

GDP-Weighted Index

49.1

Free-Weighted Index

The seasonally adjusted BNZ – BusinessNZ Performance of Composite Index or PCI (which combines the PMI and PSI) saw the two options for measuring the November PCI again show contrasting outcomes.

The November GDP-Weighted Index (47.0) increased 0.9 points from October, while the Free-Weighted Index (49.1) decreased 0.9 points, slipping back into contraction.

PCI Time Series Table

The results are seasonally adjusted.

National Indices Nov
2020
Jul
2021
Aug
2021
Sep
2021
Oct
2021
Nov
2021
GDP-Weighted Index 47.0 56.7 36.1 47.4 46.1 47.0
Free-Weighted Index 50.1 60.9 37.4 49.1 50.0 49.1

BNZ – BusinessNZ PCI Time Series

November 2017 – November 2021

About the PCI

The BNZ – BusinessNZ Performance of Composite Index (PCI) takes into account results from both the Performance of Manufacturing Index (PMI) and the Performance of Services Index (PSI). Combined results are shown in two ways:

GDP-Weighted Index:
Apportions the weight of the manufacturing and services index within the economy to produce an overall result.

Free-Weighted Index:
Combines data from both indexes to produce an overall result.

Both time series for the PCI are then seasonally adjusted.

BNZ - BusinessNZ PCI

Time Series Data

View seasonally adjusted and unadjusted time series data for the BNZ - BusinessNZ PCI

Our Contributors

The BNZ – BusinessNZ PSI contains data obtained through BusinessNZ’s regional organisations