BNZ – BusinessNZ
Performance of
Services Index

Step Down – PSI

15 Nov, 2021
44.6
October
-1.9

Monthly Change

contracting
faster rate

New Zealand’s services sector stepped further into contraction during October, according to the BNZ – BusinessNZ Performance of Services Index (PSI).

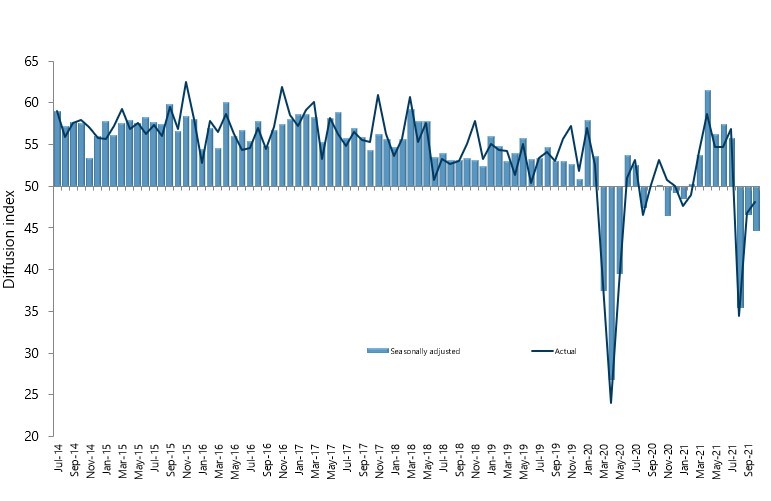
The PSI for October was 44.6 (A PSI reading above 50.0 indicates that the service sector is generally expanding; below 50.0 that it is declining).  This was down 1.9 points from September, reversing some of the 11.1 point increase from August to September.

BusinessNZ chief executive Kirk Hope said that it was disappointing that the gains in September did not also flow through to October.

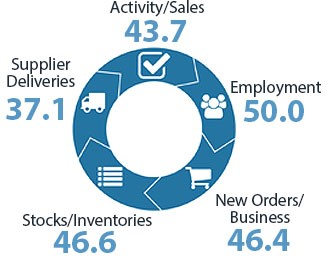
“The key sub-indexes of Activity/Sales (43.7) and New Orders/Business (46.4) still clearly remain in contraction, while Employment (50.0) remains unchanged.  With Auckland taking another recent step towards opening up, this will hopefully provide greater ability for a number of service sector businesses in New Zealand’s largest city to lift their activity levels and prepare more fully for the Xmas period ahead.”

BNZ Senior Economist Doug Steel said that “the ongoing weakness in services overall – in contrast to the improvement we saw in last week’s Performance of Manufacturing Index – fits with our thinking that any bounce in Q4 GDP will be modest, especially in comparison to the decline in Q3.”

Kirk Hope

Kirk Hope

CEO, BusinessNZ

BNZ - BusinessNZ PSI

Time Series Data

View seasonally adjusted and unadjusted time series data for the BNZ - BusinessNZ PSI

Services Landscape

PSI pain continues

The Performance of Services Index (PSI) reveals a sector with segments enduring significant pain. Disconcertingly, October’s 44.6 result is nearly 2 full points back from September’s already very weak 46.5. Moreover, this marks the third consecutive month well below the breakeven 50 mark as Covid restrictions linger.
Read more

Not uniform

The recent hit to service sector performance has not been uniform. Across industries for example, unadjusted PSI readings over the past three months indicate that the burden of restrictions has fallen heaviest on the likes of the cultural, recreational, and personal industries, hospitality, and transport and storage.
Read more

Regional differences

Non uniformity is also a feature across regions. It is no surprise to see Northern remaining the weakest, given its relative tightness in Covid restrictions. In contrast, the Central and Canterbury/Westland regions posted a decent lift from prior weakness with 58.0 and 57.2 respectively in October.
Read more

Size matters

Performance varied significantly by firm size in October.  Bigger firms tended to do better than smaller firms. At the extremes, large firms (those with 101 or more staff) outperformed (with PSI at 57.8), while micro firms (1 to 10 staff) have continued to underperform (42.3).
Read more

Doug Steel

Doug Steel

Senior Economist, BNZ

Sponsor Statement

BNZ is delighted to be associated with the Performance of Services Index (PSI) and BusinessNZ.

This association brings together the significant experience of leading business advocacy body BusinessNZ, and business finance specialist BNZ.

We look forward to continuing our association with BusinessNZ and associated regional organisations, and to playing our part in the ongoing development of the New Zealand service sector.

PSI Time Series Table

The results are seasonally adjusted.

National Indicies Oct
2020
Jun
2021
Jul
2021
Aug
2021
Sep
2021
Oct
2021
BNZ – BusinessNZ PSI 50.1 57.5 55.8 35.4 46.5 44.6
Activity/Sales 49.2 60.9 61.3 25.0 45.1 43.7
Employment 49.7 56.5 54.3 49.0 51.4 50.0
New Orders/Business 55.7 64.3 59.2 32.6 47.4 46.4
Stocks/Inventories 52.3 50.3 50.9 47.6 50.5 46.6
Supplier Deliveries 45.2 45.2 46.1 26.6 41.5 37.1

BNZ – BusinessNZ PSI Time Series

October 2017 – October 2021

International Results

J.P. Morgan Global Manufacturing PSITM

04 Nov 2021
55.6

About the PSI

The BNZ – BusinessNZ Performance of Services Index is a monthly survey of the service sector providing an early indicator of activity levels.

A PSI reading above 50 points indicates service activity is expanding; below 50 indicates it is contracting.

The main PSI and sub-index results are seasonally adjusted.

Technical Contact

Stephen Summers
Economist, BusinessNZ

[email protected]

PSI Releases

Lost momentum

New Zealand’s services sector fell back into contraction during March, according to the BNZ – BusinessNZ Performance of Services Index (PSI). The PSI for March was 47.5 (A PSI reading above 50.0 indicates that the service sector is generally expanding; below 50.0 that...

Path of expansion

New Zealand’s services sector continued its path of expansion in February, according to the BNZ – BusinessNZ Performance of Services Index (PSI). The PSI for February was 53.0 (A PSI reading above 50.0 indicates that the service sector is generally expanding; below...

Green shoots?

New Zealand’s services sector climbed back into expansion for the start of 2024, according to the BNZ – BusinessNZ Performance of Services Index (PSI). The PSI for January was 52.1 (A PSI reading above 50.0 indicates that the service sector is generally expanding;...

Activity on holiday

New Zealand’s services sector fell back into contraction during December, according to the BNZ – BusinessNZ Performance of Services Index (PSI). The PSI for December was 48.8 (A PSI reading above 50.0 indicates that the service sector is generally expanding; below...

Over the line

New Zealand’s services sector recorded expansion in November, according to the BNZ – BusinessNZ Performance of Services Index (PSI). The PSI for November was 51.2 (A PSI reading above 50.0 indicates that the service sector is generally expanding; below 50.0 that it is...

BNZ – BusinessNZ
Performance of
Composite Index

45.9

GDP-Weighted Index

49.9

Free-Weighted Index

The seasonally adjusted BNZ – BusinessNZ Performance of Composite Index or PCI (which combines the PMI and PSI) saw the two options for measuring the October PCI show contrasting outcomes.

The October GDP-Weighted Index (45.9) decreased 1.4 points from September, while the Free-Weighted Index (49.9) rose 0.8 points.

PCI Time Series Table

The results are seasonally adjusted.

National Indices Oct
2020
Jun
2021
Jul
2021
Aug
2021
Sep
2021
Oct
2021
GDP-Weighted Index 50.2 57.9 56.6 36.0 47.3 45.9
Free-Weighted Index 50.5 59.0 60.8 37.5 49.1 49.9

BNZ – BusinessNZ PCI Time Series

October 2017 – October 2021

About the PCI

The BNZ – BusinessNZ Performance of Composite Index (PCI) takes into account results from both the Performance of Manufacturing Index (PMI) and the Performance of Services Index (PSI). Combined results are shown in two ways:

GDP-Weighted Index:
Apportions the weight of the manufacturing and services index within the economy to produce an overall result.

Free-Weighted Index:
Combines data from both indexes to produce an overall result.

Both time series for the PCI are then seasonally adjusted.

BNZ - BusinessNZ PCI

Time Series Data

View seasonally adjusted and unadjusted time series data for the BNZ - BusinessNZ PCI

Our Contributors

The BNZ – BusinessNZ PSI contains data obtained through BusinessNZ’s regional organisations