BNZ – BusinessNZ
Performance of
Services Index

Over the line – PSI

19 Apr, 2021
52.4
March
+2.7

Monthly Change

expanding
previously contracting

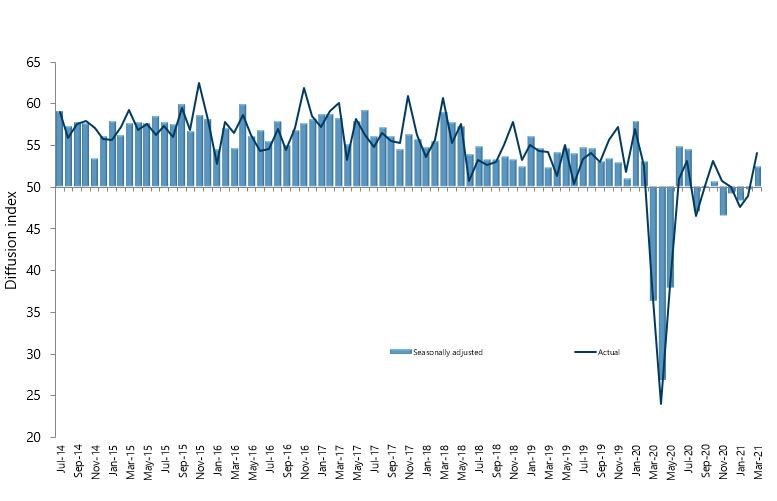
Activity in New Zealand’s services sector climbed into expansion during March for the first time in five months, according to the BNZ – BusinessNZ Performance of Services Index (PSI).

The PSI for March was 52.4, which was up 2.7 points from February (A PSI reading above 50.0 indicates that the service sector is generally expanding; below 50.0 that it is declining).  This was the highest result since July 2020, although still below the long term average of 53.8.

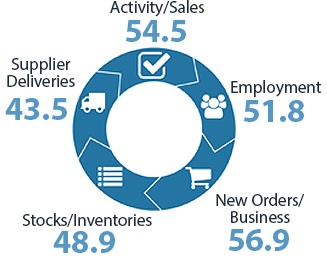
BusinessNZ chief executive Kirk Hope said that a lift in the key sub-index of New Orders/Business (56.9) led the way towards expansion in March, followed by Activity/Sales (54.5).  The other three sub-indices continue to show either lacklustre expansion or remain in contraction.

“Any sustained shift towards the services sector exhibiting ongoing expansion will need to see activity/sales and new orders remaining near or above their long term average results to continue momentum”.

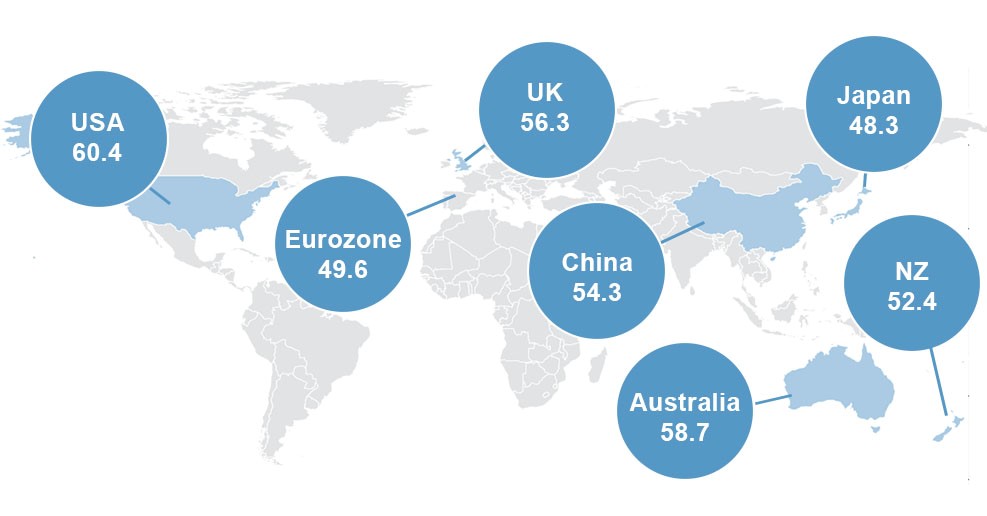
BNZ Senior Economist Craig Ebert said that “as decent as New Zealand’s PSI was for March, with its 52.4, it was shy of where the global PSI got to for the month, namely 54.7. Of course, it’s all relative to recent history, which for many countries abroad has meant a lift out of a hole rather than onto a podium”.

Kirk Hope

Kirk Hope

CEO, BusinessNZ

BNZ - BusinessNZ PSI

Time Series Data

View seasonally adjusted and unadjusted time series data for the BNZ - BusinessNZ PSI

Services Landscape

The PSI

New Zealand’s Performance of Services Index (PSI) reclaimed an expansive tone in March. It wasn’t ballistic, like the PMI (63.6) was for the month. However, at 52.4 the PSI wasn’t far below its long-term average (53.8) and broke a 4- month run of contractionary readings in the process.
Read more

Capacity Constraint

Supply issues were also indicated in last week’s NZIER Quarterly Survey of Business Opinion (QSBO). Difficulty in finding staff, for instance – whether skilled or unskilled – had clearly returned with a vengeance amongst service sector respondents.
Read more

Less Restricted

As we noted in last month’s report, “there is good reason to believe the PSI can bounce in March, because February was beset by the latest rash of lockdowns”. Yes, restrictions continued into early March, but a downscaling of these was the main tendency though the month, especially regards Auckland.
Read more

NZ Following Global Lead

As decent as New Zealand’s PSI was for March, with its 52.4, it was shy of where the global PSI got to for the month, namely 54.7. Of course, it’s all relative to recent history, which for many countries abroad has meant a lift out of a hole rather than onto a podium.
Read more

Craig Ebert

Craig Ebert

Senior Economist, BNZ

Sponsor Statement

BNZ is delighted to be associated with the Performance of Services Index (PSI) and BusinessNZ.

This association brings together the significant experience of leading business advocacy body BusinessNZ, and business finance specialist BNZ.

We look forward to continuing our association with BusinessNZ and associated regional organisations, and to playing our part in the ongoing development of the New Zealand service sector.

PSI Time Series Table

The results are seasonally adjusted.

National Indicies Mar
2020
Nov
2020
Dec
2020
Jan
2021
Feb
2021
Mar
2021
BNZ – BusinessNZ PSI 36.3 46.6 49.2 48.3 49.7 52.4
Activity/Sales 28.0 45.7 51.3 47.2 51.3 54.5
Employment 46.3 49.4 52.7 46.3 51.1 51.8
New Orders/Business 32.6 51.8 50.8 53.8 51.1 56.9
Stocks/Inventories 44.8 45.9 48.4 50.0 46.0 48.9
Supplier Deliveries 33.1 39.6 39.8 41.9 41.0 43.5

BNZ – BusinessNZ PSI Time Series

March 2017 – March 2021

International Results

J.P. Morgan Global Manufacturing PSITM

07 Apr 2021
54.7

About the PSI

The BNZ – BusinessNZ Performance of Services Index is a monthly survey of the service sector providing an early indicator of activity levels.

A PSI reading above 50 points indicates service activity is expanding; below 50 indicates it is contracting.

The main PSI and sub-index results are seasonally adjusted.

Technical Contact

Stephen Summers
Economist, BusinessNZ

[email protected]

PSI Releases

Lost momentum

New Zealand’s services sector fell back into contraction during March, according to the BNZ – BusinessNZ Performance of Services Index (PSI). The PSI for March was 47.5 (A PSI reading above 50.0 indicates that the service sector is generally expanding; below 50.0 that...

Path of expansion

New Zealand’s services sector continued its path of expansion in February, according to the BNZ – BusinessNZ Performance of Services Index (PSI). The PSI for February was 53.0 (A PSI reading above 50.0 indicates that the service sector is generally expanding; below...

Green shoots?

New Zealand’s services sector climbed back into expansion for the start of 2024, according to the BNZ – BusinessNZ Performance of Services Index (PSI). The PSI for January was 52.1 (A PSI reading above 50.0 indicates that the service sector is generally expanding;...

Activity on holiday

New Zealand’s services sector fell back into contraction during December, according to the BNZ – BusinessNZ Performance of Services Index (PSI). The PSI for December was 48.8 (A PSI reading above 50.0 indicates that the service sector is generally expanding; below...

Over the line

New Zealand’s services sector recorded expansion in November, according to the BNZ – BusinessNZ Performance of Services Index (PSI). The PSI for November was 51.2 (A PSI reading above 50.0 indicates that the service sector is generally expanding; below 50.0 that it is...

BNZ – BusinessNZ
Performance of
Composite Index

53.7

GDP-Weighted Index

58.0

Free-Weighted Index

The seasonally adjusted BNZ – BusinessNZ Performance of Composite Index or PCI (which combines the PMI and PSI) saw the two options for measuring the PCI showed both increase in expansion during March.

The March GDP-Weighted Index (53.7) rose 3.3 points in March, while the Free-Weighted Index (58.0) increased 5.9 points.

PCI Time Series Table

The results are seasonally adjusted.

National Indices Mar
2020
Nov
2020
Dec
2020
Jan
2021
Feb
2021
Mar
2021
GDP-Weighted Index 36.5 47.6 49.3 49.7 50.4 53.7
Free-Weighted Index 36.8 50.6 49.6 53.2 52.1 58.0

BNZ – BusinessNZ PCI Time Series

March 2017 – March 2021

About the PCI

The BNZ – BusinessNZ Performance of Composite Index (PCI) takes into account results from both the Performance of Manufacturing Index (PMI) and the Performance of Services Index (PSI). Combined results are shown in two ways:

GDP-Weighted Index:
Apportions the weight of the manufacturing and services index within the economy to produce an overall result.

Free-Weighted Index:
Combines data from both indexes to produce an overall result.

Both time series for the PCI are then seasonally adjusted.

BNZ - BusinessNZ PCI

Time Series Data

View seasonally adjusted and unadjusted time series data for the BNZ - BusinessNZ PCI

Our Contributors

The BNZ – BusinessNZ PSI contains data obtained through BusinessNZ’s regional organisations