BNZ – BusinessNZ
Performance of
Services Index

Outside the zone – PSI

20 Sep, 2021
35.6
August
-20.3

Monthly Change

contracting
previously expanding

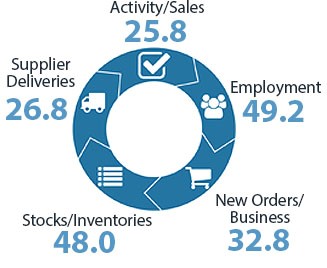
New Zealand’s services sector fell back in contraction during August, according to the BNZ – BusinessNZ Performance of Services Index (PSI).

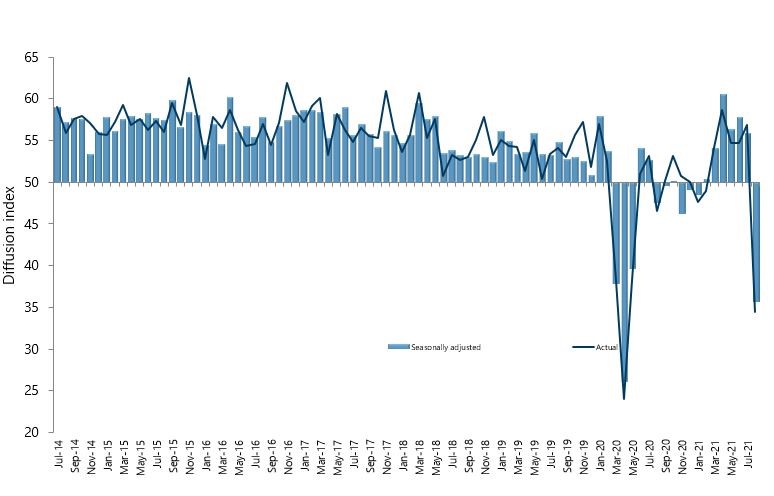
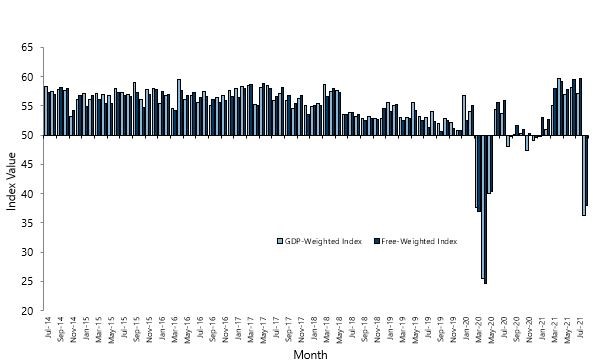
The PSI for August was 35.6 (A PSI reading above 50.0 indicates that the service sector is generally expanding; below 50.0 that it is declining).  This was the second lowest level of activity since the survey began, with the April 2020 result still the lowest during the national lockdown last year.

BusinessNZ chief executive Kirk Hope said that like its sister survey the PMI, the national lockdown was the sole influencing factor causing service sector activity levels to plunge into contraction.  Even for those outside Auckland moving down alert levels to resume business activity, there will be residual effects at least through September with both uncertainty and lower alert level restrictions playing their part.

BNZ Senior Economist Craig Ebert said that “while the August result wasn’t quite as bad as the 26.0 it plunged to in April 2020, the September 2021 result might be the better marker as the first half of August’s trading would have been solid, if July’s PSI result of 55.9 was any lead.”

Kirk Hope

Kirk Hope

CEO, BusinessNZ

BNZ - BusinessNZ PSI

Time Series Data

View seasonally adjusted and unadjusted time series data for the BNZ - BusinessNZ PSI

Services Landscape

The PSI

While we all understand the need to control COVID-19, it’s also important to recognize how much damage lockdowns do to the economy. Encouragingly, business expectations for future activity levels have been holding up better than they did during last year’s lockdowns. However, the latest hit to the economy appears roughly comparable.
Read more

Composition

Similarities to last year’s (first) lockdown were also evident in the latest PSI’s component detail, in that Activity/Sales (25.8) and New Orders/Business (32.8) were hit the hardest.  And, it was no surprise to see the overwhelming majority of comments denoted as “negative”, with reference to COVID.
Read more

Industry features

By industry, there was a familiar pattern regarding who suffers the most from lockdowns. Accommodation, Cafes & Restaurants, for example, slumped to 21.4, which was about as bad as things got back in April 2020 (18.1). Cultural, Recreational & Personal was the weakest industry in August 2021, however, with 20.0.
Read more

GDP inferences

While it’s difficult to map the PSI (and PMI) precisely onto GDP, there is certainly a warning in August’s composite PCI that the hit to Q3 2021 GDP could be closer to what we saw in Q2 of 2020 than is the consensus view.
Read more

Craig Ebert

Craig Ebert

Senior Economist, BNZ

Sponsor Statement

BNZ is delighted to be associated with the Performance of Services Index (PSI) and BusinessNZ.

This association brings together the significant experience of leading business advocacy body BusinessNZ, and business finance specialist BNZ.

We look forward to continuing our association with BusinessNZ and associated regional organisations, and to playing our part in the ongoing development of the New Zealand service sector.

PSI Time Series Table

The results are seasonally adjusted.

National Indicies Aug
2020
Apr
2021
May
2021
Jun
2021
Jul
2021
Aug
2021
BNZ – BusinessNZ PSI 47.6 60.6 56.4 57.8 55.9 35.6
Activity/Sales 46.6 61.9 58.7 61.8 61.0 25.8
Employment 47.8 61.0 54.3 56.4 54.8 49.2
New Orders/Business 49.2 67.1 62.4 64.6 60.0 32.8
Stocks/Inventories 49.4 55.2 51.2 50.6 51.4 48.0
Supplier Deliveries 45.4 47.0 45.3 45.9 46.8 26.8

BNZ – BusinessNZ PSI Time Series

August 2017 – August 2021

International Results

J.P. Morgan Global Manufacturing PSITM

03 Sep 2021
52.9

About the PSI

The BNZ – BusinessNZ Performance of Services Index is a monthly survey of the service sector providing an early indicator of activity levels.

A PSI reading above 50 points indicates service activity is expanding; below 50 indicates it is contracting.

The main PSI and sub-index results are seasonally adjusted.

Technical Contact

Stephen Summers
Economist, BusinessNZ

[email protected]

PSI Releases

Lost momentum

New Zealand’s services sector fell back into contraction during March, according to the BNZ – BusinessNZ Performance of Services Index (PSI). The PSI for March was 47.5 (A PSI reading above 50.0 indicates that the service sector is generally expanding; below 50.0 that...

Path of expansion

New Zealand’s services sector continued its path of expansion in February, according to the BNZ – BusinessNZ Performance of Services Index (PSI). The PSI for February was 53.0 (A PSI reading above 50.0 indicates that the service sector is generally expanding; below...

Green shoots?

New Zealand’s services sector climbed back into expansion for the start of 2024, according to the BNZ – BusinessNZ Performance of Services Index (PSI). The PSI for January was 52.1 (A PSI reading above 50.0 indicates that the service sector is generally expanding;...

Activity on holiday

New Zealand’s services sector fell back into contraction during December, according to the BNZ – BusinessNZ Performance of Services Index (PSI). The PSI for December was 48.8 (A PSI reading above 50.0 indicates that the service sector is generally expanding; below...

Over the line

New Zealand’s services sector recorded expansion in November, according to the BNZ – BusinessNZ Performance of Services Index (PSI). The PSI for November was 51.2 (A PSI reading above 50.0 indicates that the service sector is generally expanding; below 50.0 that it is...

BNZ – BusinessNZ
Performance of
Composite Index

36.2

GDP-Weighted Index

38.0

Free-Weighted Index

The seasonally adjusted BNZ – BusinessNZ Performance of Composite Index or PCI (which combines the PMI and PSI) saw the two options for measuring the August PCI both fall into significant contraction.

The August GDP-Weighted Index (36.2) decreased 20.9 points from July, while the Free-Weighted Index (38.0) fell 21.6 points.

PCI Time Series Table

The results are seasonally adjusted.

National Indices Aug
2020
Apr
2021
May
2021
Jun
2021
Jul
2021
Aug
2021
GDP-Weighted Index 48.1 59.7 56.9 58.1 57.1 36.2
Free-Weighted Index 49.8 59.1 57.9 59.4 59.6 38.0

BNZ – BusinessNZ PCI Time Series

August 2017 – August 2021

About the PCI

The BNZ – BusinessNZ Performance of Composite Index (PCI) takes into account results from both the Performance of Manufacturing Index (PMI) and the Performance of Services Index (PSI). Combined results are shown in two ways:

GDP-Weighted Index:
Apportions the weight of the manufacturing and services index within the economy to produce an overall result.

Free-Weighted Index:
Combines data from both indexes to produce an overall result.

Both time series for the PCI are then seasonally adjusted.

BNZ - BusinessNZ PCI

Time Series Data

View seasonally adjusted and unadjusted time series data for the BNZ - BusinessNZ PCI

Our Contributors

The BNZ – BusinessNZ PSI contains data obtained through BusinessNZ’s regional organisations