BNZ – BusinessNZ
Performance of
Services Index

Service slowdown – PSI

16 Mar, 2020
52.0
February
-5.2

Monthly Change

expanding
slower rate

New Zealand’s services sector dropped to its lowest level of activity since 2012, according to the BNZ – BusinessNZ Performance of Services Index (PSI).

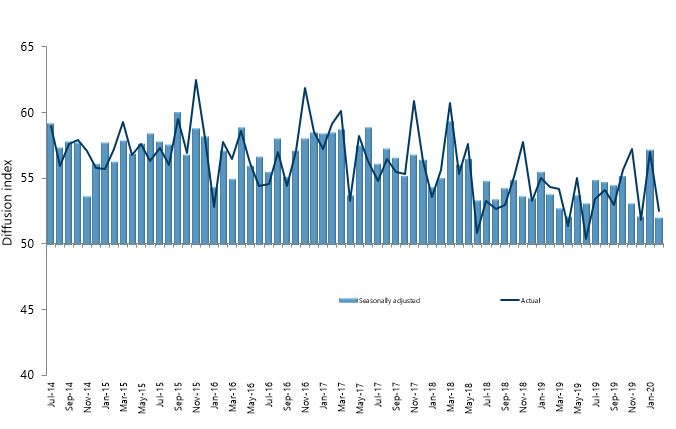
The PSI for February was 52.0, which was 5.2 points down from January (A PSI reading above 50.0 indicates that the service sector is generally expanding; below 50.0 that it is declining).  The February result was the lowest level of expansion since September 2012, and below the long term average of 54.4 for the survey.

BusinessNZ chief executive Kirk Hope said that the slowdown in overall activity was across the board.

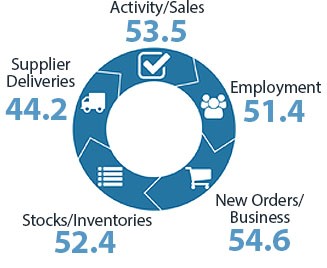
“All the main sub-indexes for the PSI displayed lower levels of activity in comparison with the previous month.  Supplier deliveries (44.2) was hit hardest, with its lowest level since November 2008.”

“Like its sister survey the PMI, there was a marked increase in the number of respondents mentioning Covid-19.  How much more this plays out in the months ahead will obviously depend on the ability to slow down its spread both domestically and offshore.”

BNZ Senior Economist Doug Steel said that “the February PSI and PMI readings look like the calm before the storm. The upcoming readings will help give a timely assessment of activity levels.”

Kirk Hope

Kirk Hope

CEO, BusinessNZ

BNZ - BusinessNZ PSI

Time Series Data

View seasonally adjusted and unadjusted time series data for the BNZ - BusinessNZ PSI

Services Landscape

Still Growing

At one level, February’s Performance of Services Index (PSI) looks weak at 52.0. But in the context of a very strong 57.2 January result, it could be seen as being not too bad. That said, it tells you something when you get the weakest survey reading since 2012 and it comes with a sense that it could have been worse.
Read more

Signs Of Weakness Appearing

While the overall PSI result might have held together better than it might have, there were clear pockets of weakness starting to appear. For example, the activity/sales, employment, and new orders components all dipped below average.
Read more

Calm Before The Storm

The still-positive, albeit not by much, PSI coincided with the good looking Performance of Manufacturing Index (PMI) in the month. Together, they give a possibility that Q1 GDP growth might yet just hang on to a positive sign.
Read more

Doug Steel

Doug Steel

Senior Economist, BNZ

Sponsor Statement

BNZ is delighted to be associated with the Performance of Services Index (PSI) and BusinessNZ.

This association brings together the significant experience of leading business advocacy body BusinessNZ, and business finance specialist BNZ.

We look forward to continuing our association with BusinessNZ and associated regional organisations, and to playing our part in the ongoing development of the New Zealand service sector.

PSI Time Series Table

The results are seasonally adjusted.

National Indicies Feb
2019
Oct
2019
Nov
2019
Dec
2019
Jan
2020
Feb
2020
BNZ – BusinessNZ PSI 53.8 55.2 53.1 52.1 57.2 52.0
Activity/Sales 53.2 57.8 54.0 52.6 56.8 53.5
Employment 51.9 51.4 51.6 52.3 52.8 51.4
New Orders/Business 59.1 62.3 53.4 55.1 62.9 54.6
Stocks/Inventories 50.1 51.4 58.8 51.8 57.3 52.4
Supplier Deliveries 49.8 49.6 51.8 48.7 57.0 44.2

BNZ – BusinessNZ PSI Time Series

February 2016 – February 2020

International Results

J.P. Morgan Global Manufacturing PSITM

04 Mar 2020
47.1

About the PSI

The BNZ – BusinessNZ Performance of Services Index is a monthly survey of the service sector providing an early indicator of activity levels.

A PSI reading above 50 points indicates service activity is expanding; below 50 indicates it is contracting.

The main PSI and sub-index results are seasonally adjusted.

Technical Contact

Stephen Summers
Economist, BusinessNZ

[email protected]

PSI Releases

Lost momentum

New Zealand’s services sector fell back into contraction during March, according to the BNZ – BusinessNZ Performance of Services Index (PSI). The PSI for March was 47.5 (A PSI reading above 50.0 indicates that the service sector is generally expanding; below 50.0 that...

Path of expansion

New Zealand’s services sector continued its path of expansion in February, according to the BNZ – BusinessNZ Performance of Services Index (PSI). The PSI for February was 53.0 (A PSI reading above 50.0 indicates that the service sector is generally expanding; below...

Green shoots?

New Zealand’s services sector climbed back into expansion for the start of 2024, according to the BNZ – BusinessNZ Performance of Services Index (PSI). The PSI for January was 52.1 (A PSI reading above 50.0 indicates that the service sector is generally expanding;...

Activity on holiday

New Zealand’s services sector fell back into contraction during December, according to the BNZ – BusinessNZ Performance of Services Index (PSI). The PSI for December was 48.8 (A PSI reading above 50.0 indicates that the service sector is generally expanding; below...

Over the line

New Zealand’s services sector recorded expansion in November, according to the BNZ – BusinessNZ Performance of Services Index (PSI). The PSI for November was 51.2 (A PSI reading above 50.0 indicates that the service sector is generally expanding; below 50.0 that it is...

BNZ – BusinessNZ
Performance of
Composite Index

52.3

GDP-Weighted Index

53.1

Free-Weighted Index

The seasonally adjusted BNZ – BusinessNZ Performance of Composite Index or PCI (which combines the PMI and PSI) saw the two options for measuring the PCI both decrease from the previous month.

The February GDP-Weighted Index (52.3) decreased 4.4 points from January, while the Free-Weighted Index (53.1) fell 0.1 points.  The fact that the services sector displayed a larger fall compared with the increase in the manufacturing sector caused the GDP-Weighted Index to produce a lower result, while leaving the Free-Weighted Index largely unchanged.

PCI Time Series Table

The results are seasonally adjusted.

National Indices Feb
2019
Oct
2019
Nov
2019
Dec
2019
Jan
2020
Feb
2020
GDP-Weighted Index 53.7 54.8 52.8 52.0 56.7 52.3
Free-Weighted Index 53.9 54.8 52.3 51.7 53.2 53.1

BNZ – BusinessNZ PCI Time Series

February 2016 – February 2020

About the PCI

The BNZ – BusinessNZ Performance of Composite Index (PCI) takes into account results from both the Performance of Manufacturing Index (PMI) and the Performance of Services Index (PSI). Combined results are shown in two ways:

GDP-Weighted Index:
Apportions the weight of the manufacturing and services index within the economy to produce an overall result.

Free-Weighted Index:
Combines data from both indexes to produce an overall result.

Both time series for the PCI are then seasonally adjusted.

BNZ - BusinessNZ PCI

Time Series Data

View seasonally adjusted and unadjusted time series data for the BNZ - BusinessNZ PCI

Our Contributors

The BNZ – BusinessNZ PSI contains data obtained through BusinessNZ’s regional organisations