BNZ – BusinessNZ
Performance of
Services Index

Out of service – PSI

18 May, 2020
25.9
April
-11.4

Monthly Change

contracting
faster rate

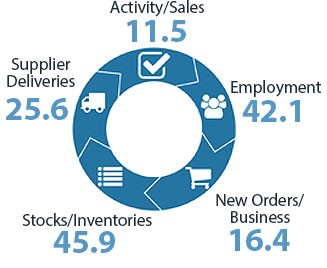
Activity in New Zealand’s services sector ground to a halt during April, according to the BNZ – BusinessNZ Performance of Services Index (PSI).

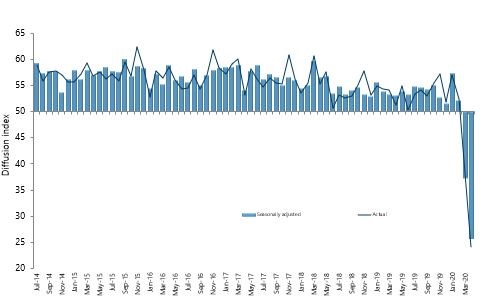
The PSI for April was 25.9, which was 11.4 points down from March* (A PSI reading above 50.0 indicates that the service sector is generally expanding; below 50.0 that it is declining).  The April result was also the lowest level of activity since the survey began in 2007.

BusinessNZ chief executive Kirk Hope said that like its sister survey the PMI, the almost total lockdown of the country at level 4 meant most businesses were either significantly affected, or simply couldn’t trade at all during April.

“The proportion of negative comments for April stood at 91%, with COVID-19 the key word used throughout.  Given the move to level 2 last week for most businesses, a return to higher levels of activity is expected looking forward.  However, the social distancing restrictions that remain in place will still provide a brake for many.”  

BNZ Senior Economist Craig Ebert said that “a sizable rate of contraction is what you get when businesses are forbidden from operating, especially those with a customer-facing focus. Covid-19 has seen to that, with policy responses reinforcing the sudden stop”.

*Due to not running the March 2020 PSI because of COVID-19, the March figures have been obtained by taking an average of both the actual combined February 2020 and April 2020 values.  The results have then been seasonally adjusted.

Kirk Hope

Kirk Hope

CEO, BusinessNZ

BNZ - BusinessNZ PSI

Time Series Data

View seasonally adjusted and unadjusted time series data for the BNZ - BusinessNZ PSI

Services Landscape

The PSI

As low as it was, the 25.9 reading on the Performance of Services Index (PSI) for April shouldn’t have come as any surprise. A sizable rate of contraction is what you get when businesses are forbidden from operating, especially those with a customer-facing focus.
Read more

Details

There wasn’t a great deal of variation across service industry type, with all registering very low readings for April (in unadjusted terms).
Read more

Employment

If there was any good news in the latest PSI, it’s something we also saw in the PMI. That is, a relative resilience about staffing. Not a positive one, for sure, but a lot less negative than other aspects of the survey.
Read more

Global

Unemployment might not look to be as bad in New Zealand as it’s getting in a global sense (witness the US jobless rate at 14.7% in April). However, our readings on the PSI and PMI are, broadly speaking, very much in the thick of the weakness we’ve seen across the world.
Read more

Craig Ebert

Craig Ebert

Senior Economist, BNZ

Sponsor Statement

BNZ is delighted to be associated with the Performance of Services Index (PSI) and BusinessNZ.

This association brings together the significant experience of leading business advocacy body BusinessNZ, and business finance specialist BNZ.

We look forward to continuing our association with BusinessNZ and associated regional organisations, and to playing our part in the ongoing development of the New Zealand service sector.

PSI Time Series Table

The results are seasonally adjusted.

National Indicies Apr
2019
Dec
2019
Jan
2020
Feb
2020
Mar
2020
Apr
2020
BNZ – BusinessNZ PSI 53.0 51.4 57.3 52.1 37.3 25.9
Activity/Sales 53.7 51.2 55.5 54.5 30.4 11.5
Employment 49.3 51.9 52.9 50.8 46.4 42.1
New Orders/Business 56.8 54.0 62.9 54.6 34.7 16.4
Stocks/Inventories 50.9 51.6 58.7 51.7 45.1 45.9
Supplier Deliveries 52.8 47.5 56.9 44.2 34.2 25.6

BNZ – BusinessNZ PSI Time Series

April 2016 – April 2020

International Results

J.P. Morgan Global Manufacturing PSITM

06 May 2020
26.5

About the PSI

The BNZ – BusinessNZ Performance of Services Index is a monthly survey of the service sector providing an early indicator of activity levels.

A PSI reading above 50 points indicates service activity is expanding; below 50 indicates it is contracting.

The main PSI and sub-index results are seasonally adjusted.

Technical Contact

Stephen Summers
Economist, BusinessNZ

[email protected]

PSI Releases

Lost momentum

New Zealand’s services sector fell back into contraction during March, according to the BNZ – BusinessNZ Performance of Services Index (PSI). The PSI for March was 47.5 (A PSI reading above 50.0 indicates that the service sector is generally expanding; below 50.0 that...

Path of expansion

New Zealand’s services sector continued its path of expansion in February, according to the BNZ – BusinessNZ Performance of Services Index (PSI). The PSI for February was 53.0 (A PSI reading above 50.0 indicates that the service sector is generally expanding; below...

Green shoots?

New Zealand’s services sector climbed back into expansion for the start of 2024, according to the BNZ – BusinessNZ Performance of Services Index (PSI). The PSI for January was 52.1 (A PSI reading above 50.0 indicates that the service sector is generally expanding;...

Activity on holiday

New Zealand’s services sector fell back into contraction during December, according to the BNZ – BusinessNZ Performance of Services Index (PSI). The PSI for December was 48.8 (A PSI reading above 50.0 indicates that the service sector is generally expanding; below...

Over the line

New Zealand’s services sector recorded expansion in November, according to the BNZ – BusinessNZ Performance of Services Index (PSI). The PSI for November was 51.2 (A PSI reading above 50.0 indicates that the service sector is generally expanding; below 50.0 that it is...

BNZ – BusinessNZ
Performance of
Composite Index

25.7

GDP-Weighted Index

24.0

Free-Weighted Index

The seasonally adjusted BNZ – BusinessNZ Performance of Composite Index or PCI (which combines the PMI and PSI) saw the two options for measuring the PCI both at their lowest levels ever.

The April GDP-Weighted Index (25.7) decreased 10.8 points from March, while the Free-Weighted Index (24.0) fell 12.4 points.

PCI Time Series Table

The results are seasonally adjusted.

National Indices Apr
2019
Dec
2019
Jan
2020
Feb
2020
Mar
2020
Apr
2020
GDP-Weighted Index 52.9 51.3 56.4 52.4 36.5 25.7
Free-Weighted Index 52.2 50.7 53.2 53.3 36.4 24.0

BNZ – BusinessNZ PCI Time Series

April 2016 – April 2020

About the PCI

The BNZ – BusinessNZ Performance of Composite Index (PCI) takes into account results from both the Performance of Manufacturing Index (PMI) and the Performance of Services Index (PSI). Combined results are shown in two ways:

GDP-Weighted Index:
Apportions the weight of the manufacturing and services index within the economy to produce an overall result.

Free-Weighted Index:
Combines data from both indexes to produce an overall result.

Both time series for the PCI are then seasonally adjusted.

BNZ - BusinessNZ PCI

Time Series Data

View seasonally adjusted and unadjusted time series data for the BNZ - BusinessNZ PCI

Our Contributors

The BNZ – BusinessNZ PSI contains data obtained through BusinessNZ’s regional organisations