BNZ – BusinessNZ
Performance of
Services Index

Limited service – PSI

15 Jun, 2020
37.2
May
+11.5

Monthly Change

contracting
slower rate

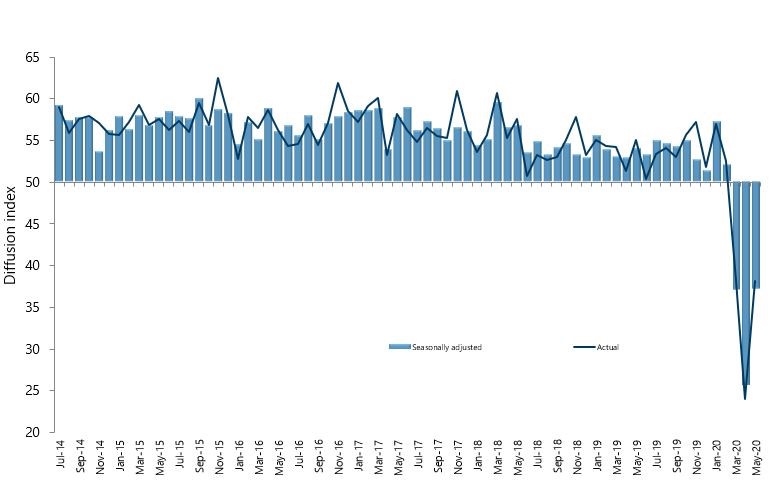
Activity in New Zealand’s services sector improved somewhat for May after its lowest ever result in April, according to the BNZ – BusinessNZ Performance of Services Index (PSI).

The PSI for May was 37.2, which was 11.5 points up from April (A PSI reading above 50.0 indicates that the service sector is generally expanding; below 50.0 that it is declining).  This was just above the March result, but still showing strong contraction for the month.

BusinessNZ chief executive Kirk Hope said that the result for May was similar to that of the manufacturing sector, with improvements made but still well below anything considered business as usual.

“The proportion of negative comments for May (72.9%) did drop from 91% in April.  Looking ahead, around two-thirds of June will be at level 1, so we would expect ongoing improvements in activity in the months ahead”. 

BNZ Senior Economist Doug Steel said that “we’d caution that just being allowed to open doesn’t guarantee more activity. Standing back, there is no denying the outright level of the PSI remains woeful and still sits well below the lows at around 45 recorded during the 2008/09 recession”.

Kirk Hope

Kirk Hope

CEO, BusinessNZ

BNZ - BusinessNZ PSI

Time Series Data

View seasonally adjusted and unadjusted time series data for the BNZ - BusinessNZ PSI

Services Landscape

The PSI

The Performance of Services Index (PSI) still looked terrible in May. However, at 37.2, it is a fair bit less terrible than April’s 25.7. The lift follows the removal of some shackles as New Zealand moved down COVID alert levels. Further improvement can be expected over coming months on similar grounds.
Read more

Employment Falls Further

Less bad readings in May compared to April were seen in nearly all areas across industries, regions, firm sizes, and major components. One glaring exception was employment, which fell further, reflecting still very poor conditions through May.
Read more

Spending Bounces

Electronic card transactions – as an indicator of spending – also looked less bad in May. Indeed, at face value the seasonally adjusted 80.7% lift in total transactions in the month looked very strong, but given it followed a near halving in April, transactions remain more than 12% below year earlier levels.
Read more

Doug Steel

Doug Steel

Senior Economist, BNZ

Sponsor Statement

BNZ is delighted to be associated with the Performance of Services Index (PSI) and BusinessNZ.

This association brings together the significant experience of leading business advocacy body BusinessNZ, and business finance specialist BNZ.

We look forward to continuing our association with BusinessNZ and associated regional organisations, and to playing our part in the ongoing development of the New Zealand service sector.

PSI Time Series Table

The results are seasonally adjusted.

National Indicies May
2019
Jan
2020
Feb
2020
Mar
2020
Apr
2020
May
2020
BNZ – BusinessNZ PSI 54.0 57.2 52.1 37.0 25.7 37.2
Activity/Sales 56.1 55.3 54.4 30.2 10.6 32.5
Employment 51.9 52.8 50.4 46.1 42.4 40.9
New Orders/Business 56.8 63.6 54.5 33.7 16.1 35.1
Stocks/Inventories 56.2 58.6 51.4 51.4 45.5 45.4
Supplier Deliveries 52.1 56.9 44.0 44.0 25.2 41.0

BNZ – BusinessNZ PSI Time Series

May 2016 – May 2020

International Results

J.P. Morgan Global Manufacturing PSITM

03 Jun 2020
36.3

About the PSI

The BNZ – BusinessNZ Performance of Services Index is a monthly survey of the service sector providing an early indicator of activity levels.

A PSI reading above 50 points indicates service activity is expanding; below 50 indicates it is contracting.

The main PSI and sub-index results are seasonally adjusted.

Technical Contact

Stephen Summers
Economist, BusinessNZ

[email protected]

PSI Releases

Lost momentum

New Zealand’s services sector fell back into contraction during March, according to the BNZ – BusinessNZ Performance of Services Index (PSI). The PSI for March was 47.5 (A PSI reading above 50.0 indicates that the service sector is generally expanding; below 50.0 that...

Path of expansion

New Zealand’s services sector continued its path of expansion in February, according to the BNZ – BusinessNZ Performance of Services Index (PSI). The PSI for February was 53.0 (A PSI reading above 50.0 indicates that the service sector is generally expanding; below...

Green shoots?

New Zealand’s services sector climbed back into expansion for the start of 2024, according to the BNZ – BusinessNZ Performance of Services Index (PSI). The PSI for January was 52.1 (A PSI reading above 50.0 indicates that the service sector is generally expanding;...

Activity on holiday

New Zealand’s services sector fell back into contraction during December, according to the BNZ – BusinessNZ Performance of Services Index (PSI). The PSI for December was 48.8 (A PSI reading above 50.0 indicates that the service sector is generally expanding; below...

Over the line

New Zealand’s services sector recorded expansion in November, according to the BNZ – BusinessNZ Performance of Services Index (PSI). The PSI for November was 51.2 (A PSI reading above 50.0 indicates that the service sector is generally expanding; below 50.0 that it is...

BNZ – BusinessNZ
Performance of
Composite Index

37.7

GDP-Weighted Index

38.2

Free-Weighted Index

The seasonally adjusted BNZ – BusinessNZ Performance of Composite Index or PCI (which combines the PMI and PSI) saw the two options for measuring the PCI both improve from the previous month.

The May GDP-Weighted Index (37.7) increased 12.2 points from April, while the Free-Weighted Index (38.2) rose 14.4 points.

PCI Time Series Table

The results are seasonally adjusted.

National Indices May
2019
Jan
2020
Feb
2020
Mar
2020
Apr
2020
May
2020
GDP-Weighted Index 53.8 56.4 52.4 36.2 25.5 37.7
Free-Weighted Index 52.6 53.2 53.2 36.3 23.8 38.2

BNZ – BusinessNZ PCI Time Series

May 2016 – May 2020

About the PCI

The BNZ – BusinessNZ Performance of Composite Index (PCI) takes into account results from both the Performance of Manufacturing Index (PMI) and the Performance of Services Index (PSI). Combined results are shown in two ways:

GDP-Weighted Index:
Apportions the weight of the manufacturing and services index within the economy to produce an overall result.

Free-Weighted Index:
Combines data from both indexes to produce an overall result.

Both time series for the PCI are then seasonally adjusted.

BNZ - BusinessNZ PCI

Time Series Data

View seasonally adjusted and unadjusted time series data for the BNZ - BusinessNZ PCI

Our Contributors

The BNZ – BusinessNZ PSI contains data obtained through BusinessNZ’s regional organisations