BNZ – BusinessNZ
Performance of
Services Index

Standard service resumes – PSI

18 Mar, 2019
53.8
February
-2.4

Monthly Change

expanding
slower rate

New Zealand’s services sector returned to expansion levels experienced in recent months, according to the BNZ – BusinessNZ Performance of Services Index (PSI).

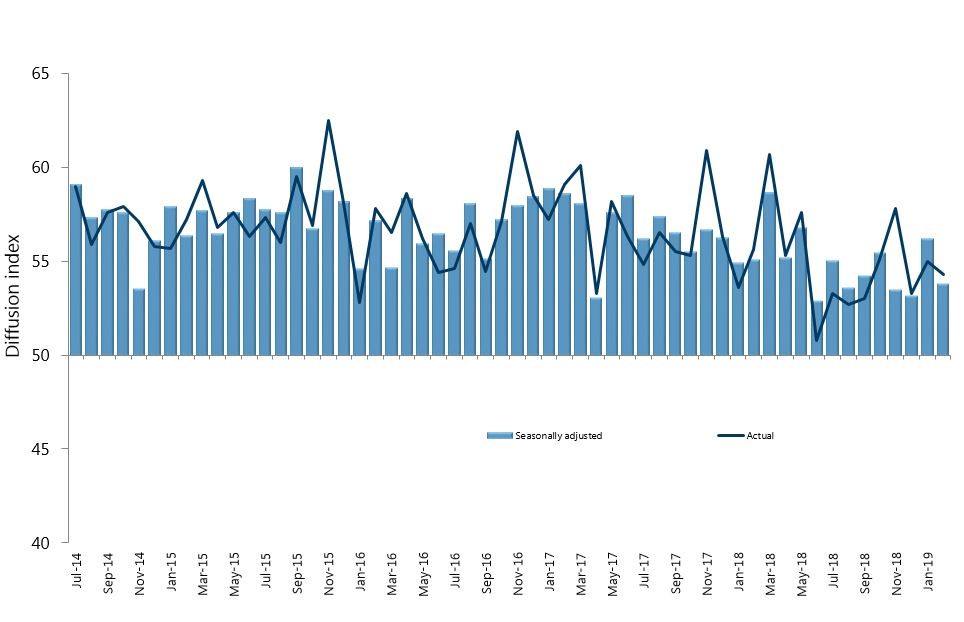
The PSI for February was 53.8, which was 2.4 points down from January (A PSI reading above 50.0 indicates that the service sector is generally expanding; below 50.0 that it is declining).  The February result was also below the long term average of 54.5 for the survey.

BusinessNZ chief executive Kirk Hope said despite the January result getting 2019 off to a solid footing, the February result meant the survey fell back in line with recent expansion levels.

“While four of the five main sub-indexes showed similar results to the previous months, the key sub-index of activity/sales (53.4) decreased 8.1 points.  Also, supplier deliveries (49.9) dipped into contraction for February.   

The decrease in overall activity levels also saw the proportion of positive comments in February (52.4%) also dip slightly, compared with January (54.0%) and December (54.4%).  A number of negative comments focussed on uncertainty in the market, along with slow demand.  However, a number of positive comments outlined new business and strong demand for certain services”. 

BNZ Senior Economist Doug Steel said “The PSI has shown little direction over the past six months, but overall indicates positive economic growth albeit a bit slower than was prevailing a year ago”.

Kirk Hope

Kirk Hope

CEO, BusinessNZ

BNZ - BusinessNZ PSI

Time Series Data

View seasonally adjusted and unadjusted time series data for the BNZ - BusinessNZ PSI

Services Landscape

Steady, If Slower, Progress

There remains no clear direction in the Performance of Services Index (PSI). Yes, it eased to 53.8 in February following a pop higher to 56.2 in January, but this simply returns the index to a level similar to that seen towards the end of last year.
Read more

Good Order

The PSI details remain mixed and choppy month to month. On a three month average basis, new orders have improved to be bordering on strong, sales expansion has been moderate and steady, while employment growth is positive but has slowed.
Read more

GDP Implications

Combining the recently steady PSI with the mild improvement seen in last week’s Performance of Manufacturing Index (PMI) provides some solace for NZ economic growth watchers.
Read more

Doug Steel

Doug Steel

Senior Economist, BNZ

Sponsor Statement

BNZ is delighted to be associated with the Performance of Services Index (PSI) and BusinessNZ.

This association brings together the significant experience of leading business advocacy body BusinessNZ, and business finance specialist BNZ.

We look forward to continuing our association with BusinessNZ and associated regional organisations, and to playing our part in the ongoing development of the New Zealand service sector.

PSI Time Series Table

The results are seasonally adjusted.

National Indicies Feb
2018
Oct
2018
Nov
2018
Dec
2018
Jan
2019
Feb
2019
BNZ – BusinessNZ PSI 55.1 55.5 53.5 53.2 56.2 53.8
Activity/Sales 54.3 57.4 53.4 52.3 61.5 53.4
Employment 50.8 53.6 55.5 50.5 52.7 51.9
New Orders/Business 61.0 58.5 57.8 59.5 61.3 59.9
Stocks/Inventories 53.9 51.9 50.3 51.2 49.9 49.3
Supplier Deliveries 54.1 51.1 48.7 51.7 51.9 49.9

BNZ – BusinessNZ PSI Time Series

February 2015 – February 2019

International Results

J.P. Morgan Global Manufacturing PSITM

05 Mar 2019
53.3

About the PSI

The BNZ – BusinessNZ Performance of Services Index is a monthly survey of the service sector providing an early indicator of activity levels.

A PSI reading above 50 points indicates service activity is expanding; below 50 indicates it is contracting.

The main PSI and sub-index results are seasonally adjusted.

Technical Contact

Stephen Summers
Economist, BusinessNZ

[email protected]

PSI Releases

Lost momentum

New Zealand’s services sector fell back into contraction during March, according to the BNZ – BusinessNZ Performance of Services Index (PSI). The PSI for March was 47.5 (A PSI reading above 50.0 indicates that the service sector is generally expanding; below 50.0 that...

Path of expansion

New Zealand’s services sector continued its path of expansion in February, according to the BNZ – BusinessNZ Performance of Services Index (PSI). The PSI for February was 53.0 (A PSI reading above 50.0 indicates that the service sector is generally expanding; below...

Green shoots?

New Zealand’s services sector climbed back into expansion for the start of 2024, according to the BNZ – BusinessNZ Performance of Services Index (PSI). The PSI for January was 52.1 (A PSI reading above 50.0 indicates that the service sector is generally expanding;...

Activity on holiday

New Zealand’s services sector fell back into contraction during December, according to the BNZ – BusinessNZ Performance of Services Index (PSI). The PSI for December was 48.8 (A PSI reading above 50.0 indicates that the service sector is generally expanding; below...

Over the line

New Zealand’s services sector recorded expansion in November, according to the BNZ – BusinessNZ Performance of Services Index (PSI). The PSI for November was 51.2 (A PSI reading above 50.0 indicates that the service sector is generally expanding; below 50.0 that it is...

BNZ – BusinessNZ
Performance of
Composite Index

54.1

GDP-Weighted Index

54.5

Free-Weighted Index

The seasonally adjusted BNZ – BusinessNZ Performance of Composite Index or PCI (which combines the PMI and PSI) saw the two options for measuring the PCI both decrease in expansion levels during February.

The February GDP-Weighted Index (54.1) decreased 1.9 points from January, while the Free-Weighted Index (54.5) decreased 0.7 points.  Despite the manufacturing sector improving from January, it was not enough to more than compensate for the lower activity level shown in the services sector for February.

PCI Time Series Table

The results are seasonally adjusted.

National Indicies Feb
2018
Oct
2018
Nov
2018
Dec
2018
Jan
2019
Feb
2019
GDP-Weighted Index 55.1 55.2 53.6 53.7 56.0 54.1
Free-Weighted Index 54.9 54.8 53.9 54.9 55.2 54.5

BNZ – BusinessNZ PCI Time Series

February 2015 – February 2019

About the PCI

The BNZ – BusinessNZ Performance of Composite Index (PCI) takes into account results from both the Performance of Manufacturing Index (PMI) and the Performance of Services Index (PSI). Combined results are shown in two ways:

GDP-Weighted Index:
Apportions the weight of the manufacturing and services index within the economy to produce an overall result.

Free-Weighted Index:
Combines data from both indexes to produce an overall result.

Both time series for the PCI are then seasonally adjusted.

BNZ - BusinessNZ PCI

Time Series Data

View seasonally adjusted and unadjusted time series data for the BNZ - BusinessNZ PCI

Our Contributors

The BNZ – BusinessNZ PSI contains data obtained through BusinessNZ’s regional organisations