BNZ – BusinessNZ
Performance of
Services Index

Softening service – PSI

15 Jul, 2019
52.7
June
-0.8

Monthly Change

expanding
slower rate

Activity in New Zealand’s services sector softened in June, according to the BNZ – BusinessNZ Performance of Services Index (PSI).

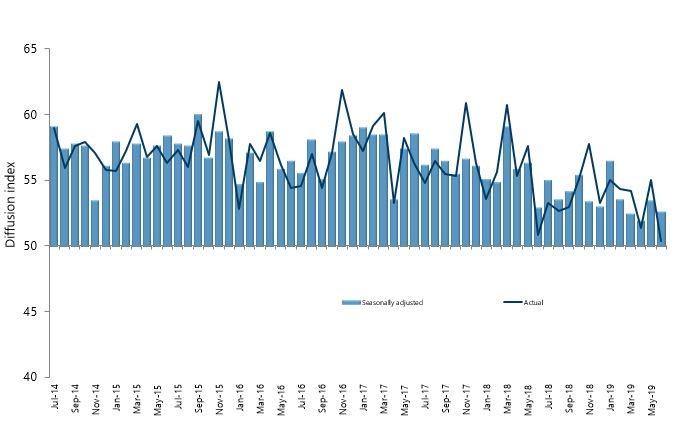
The PSI for June was 52.7, which was 0.8 points down from May, and close to activity levels last seen in March (A PSI reading above 50.0 indicates that the service sector is generally expanding; below 50.0 that it is declining).  The June result remained below the long term average of 54.4 for the survey.

BusinessNZ chief executive Kirk Hope said that the pick-up in May couldn’t be sustained, and symptomatic of a lacklustre first half of 2019 for the sector.

“The first 6 months of 2019 represented the lowest overall average activity result for that timeframe since late 2012/early 2013.  While the index has yet to get very close to the no change mark of 50, nor has it shown any signs of building momentum to pick up pace.  

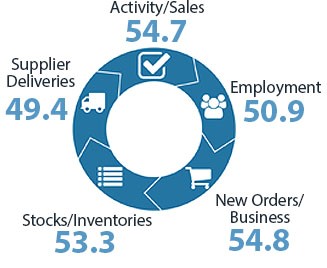
“New orders/business (54.8) continued it slowly slide to its lowest level since September 2012.  Employment (50.9) has managed to again only just keep its head above water, while supplier deliveries (49.4) again fell back into contraction.

Looking at comments from respondents, the proportion of positive comments for June (49.0%) took a hit from May (56.6%), although not as low as April (43.9%).  

BNZ Senior Economist Craig Ebert said that “the PSI still paints a picture of slow-running GDP growth for the meantime. This is reinforced by New Zealand’s PMI having dipped below trend over recent months too”.

Kirk Hope

Kirk Hope

CEO, BusinessNZ

BNZ - BusinessNZ PSI

Time Series Data

View seasonally adjusted and unadjusted time series data for the BNZ - BusinessNZ PSI

Services Landscape

The PSI

Could the slowdown in New Zealand’s services sector growth be stabilising already? Admittedly, it’s not obvious from June’s Performance of Services Index (PSI). In fact, this eased to a seasonally adjusted 52.7, from the 53.5 level it wriggled up to in May.
Read more

QSBO

More generally, however, it’s hard to tell whether the slowdown in the services sector has largely done its dash for now. Caution was certainly the message from the NZIER’s latest Quarterly Survey of Business Opinion (QSBO).
Read more

Investment/Capacity

In spite of patchy-looking output and profitability, services firms in the latest QSBO remained relatively positive in their hiring intent.
Read more

GDP

Signs of stability in the PSI over last few months – after trend dissipation over last twelve – have obviously been good to see.  That said, the PSI still paints a picture of slow-running GDP growth for the meantime.
Read more

Craig Ebert

Craig Ebert

Senior Economist, BNZ

Sponsor Statement

BNZ is delighted to be associated with the Performance of Services Index (PSI) and BusinessNZ.

This association brings together the significant experience of leading business advocacy body BusinessNZ, and business finance specialist BNZ.

We look forward to continuing our association with BusinessNZ and associated regional organisations, and to playing our part in the ongoing development of the New Zealand service sector.

PSI Time Series Table

The results are seasonally adjusted.

National Indicies Jun
2018
Feb
2019
Mar
2019
Apr
2019
May
2019
Jun
2019
BNZ – BusinessNZ PSI 53.0 53.6 52.5 52.0 53.5 52.7
Activity/Sales 54.4 53.3 52.7 51.5 54.9 54.7
Employment 50.1 51.6 51.1 48.4 50.6 50.9
New Orders/Business 58.2 59.1 55.1 55.1 55.8 54.8
Stocks/Inventories 49.9 49.5 50.1 48.9 56.9 53.3
Supplier Deliveries 49.6 50.0 50.7 51.4 51.4 49.4

BNZ – BusinessNZ PSI Time Series

June 2015 – June 2019

International Results

J.P. Morgan Global Manufacturing PSITM

03 Jul 2019
51.9

About the PSI

The BNZ – BusinessNZ Performance of Services Index is a monthly survey of the service sector providing an early indicator of activity levels.

A PSI reading above 50 points indicates service activity is expanding; below 50 indicates it is contracting.

The main PSI and sub-index results are seasonally adjusted.

Technical Contact

Stephen Summers
Economist, BusinessNZ

[email protected]

PSI Releases

Lost momentum

New Zealand’s services sector fell back into contraction during March, according to the BNZ – BusinessNZ Performance of Services Index (PSI). The PSI for March was 47.5 (A PSI reading above 50.0 indicates that the service sector is generally expanding; below 50.0 that...

Path of expansion

New Zealand’s services sector continued its path of expansion in February, according to the BNZ – BusinessNZ Performance of Services Index (PSI). The PSI for February was 53.0 (A PSI reading above 50.0 indicates that the service sector is generally expanding; below...

Green shoots?

New Zealand’s services sector climbed back into expansion for the start of 2024, according to the BNZ – BusinessNZ Performance of Services Index (PSI). The PSI for January was 52.1 (A PSI reading above 50.0 indicates that the service sector is generally expanding;...

Activity on holiday

New Zealand’s services sector fell back into contraction during December, according to the BNZ – BusinessNZ Performance of Services Index (PSI). The PSI for December was 48.8 (A PSI reading above 50.0 indicates that the service sector is generally expanding; below...

Over the line

New Zealand’s services sector recorded expansion in November, according to the BNZ – BusinessNZ Performance of Services Index (PSI). The PSI for November was 51.2 (A PSI reading above 50.0 indicates that the service sector is generally expanding; below 50.0 that it is...

BNZ – BusinessNZ
Performance of
Composite Index

52.4

GDP-Weighted Index

52.4

Free-Weighted Index

The seasonally adjusted BNZ – BusinessNZ Performance of Composite Index or PCI (which combines the PMI and PSI) saw the two options for measuring the PCI showing contrasting results in June.

The June GDP-Weighted Index (52.4) decreased 0.7 points from May, while the Free-Weighted Index (52.4) increased 0.4 points.

PCI Time Series Table

The results are seasonally adjusted.

National Indicies Jun
2018
Feb
2019
Mar
2019
Apr
2019
May
2019
Jun
2019
GDP-Weighted Index 52.8 53.7 51.9 51.8 53.1 52.4
Free-Weighted Index 53.2 54.1 51.7 51.5 52.0 52.4

BNZ – BusinessNZ PCI Time Series

June 2015 – June 2019

About the PCI

The BNZ – BusinessNZ Performance of Composite Index (PCI) takes into account results from both the Performance of Manufacturing Index (PMI) and the Performance of Services Index (PSI). Combined results are shown in two ways:

GDP-Weighted Index:
Apportions the weight of the manufacturing and services index within the economy to produce an overall result.

Free-Weighted Index:
Combines data from both indexes to produce an overall result.

Both time series for the PCI are then seasonally adjusted.

BNZ - BusinessNZ PCI

Time Series Data

View seasonally adjusted and unadjusted time series data for the BNZ - BusinessNZ PCI

Our Contributors

The BNZ – BusinessNZ PSI contains data obtained through BusinessNZ’s regional organisations