BNZ – BusinessNZ
Performance of
Services Index

Catch up – PSI

17 Jun, 2019
53.6
May
+1.6

Monthly Change

expanding
faster rate

Activity in New Zealand’s services sector picked up after three consecutive monthly falls in expansion, according to the BNZ – BusinessNZ Performance of Services Index (PSI).

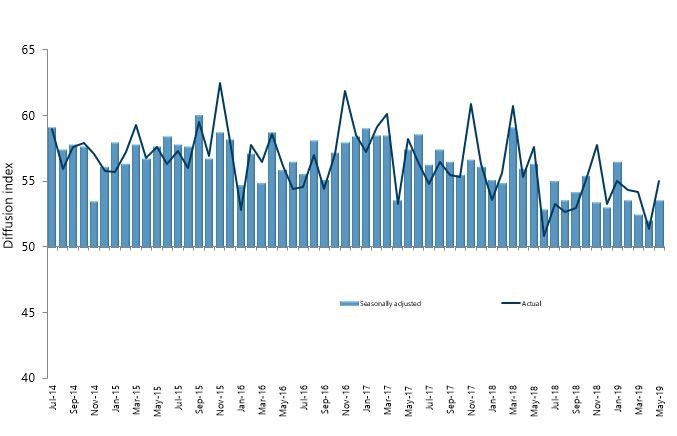
The PSI for May was 53.6, which was 1.6 points up from April, and a return to levels of activity seen in February (A PSI reading above 50.0 indicates that the service sector is generally expanding; below 50.0 that it is declining).  However, the May result was still below the long term average of 54.4 for the survey.

BusinessNZ chief executive Kirk Hope said that while the pick-up in activity is a positive step, further expansion in the coming months will be dependent on a few factors.

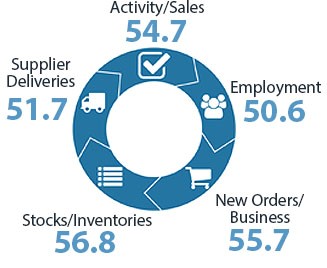
“New orders/business (55.7) has remained around that level for the last three months, which is below the long-term average of 58.6.  Given this sub-index feeds through into activity/sales and employment, a lift in this space would need to take place to improve the overall result.

Looking at comments from respondents, the proportion of positive comments for May (56.6%) recovered from April (43.9%), and was similar to March (55.8%).  A sustained improvement in the overall result would also require a consistent proportion of respondents noting positive influences on their business activity”.

BNZ Senior Economist Craig Ebert said that “overall, the results paint a picture of a slowing economy, which might struggle to live up to most forecasters’ GDP growth forecasts”.

Kirk Hope

Kirk Hope

CEO, BusinessNZ

BNZ - BusinessNZ PSI

Time Series Data

View seasonally adjusted and unadjusted time series data for the BNZ - BusinessNZ PSI

Services Landscape

PSI

As we noted last month, “unless there is a sizable bounce in May’s PSI we’ll be left with the distinct impression of a slowing services sector”. Well, there was a bounce, with the Performance of Services Index up to 53.6, from the 52.0 level it dipped to in April. However, it was hardly sizable.
Read more

Detail

Then again, the slowness in the PSI does not appear steeped across all parts. For example, Otago/Southland stood out as a regional weak spot, with an unadjusted index of 46.5 in May (and a 3-month average of 47.9).
Read more

Services GDP

Overall, however, May’s PSI does tend to affirm the impression of a slowing services sector, rather than instilling confidence that another pick-up is afoot. We are certainly guarded with respect to how services go in this week’s Q1 GDP report.
Read more

Overall GDP

While the bounce in May’s PSI wasn’t convincing it was definitely timely – given the stall we saw in the Performance of Manufacturing Index in the month (to 50.2, from 52.7).
Read more

Craig Ebert

Craig Ebert

Senior Economist, BNZ

Sponsor Statement

BNZ is delighted to be associated with the Performance of Services Index (PSI) and BusinessNZ.

This association brings together the significant experience of leading business advocacy body BusinessNZ, and business finance specialist BNZ.

We look forward to continuing our association with BusinessNZ and associated regional organisations, and to playing our part in the ongoing development of the New Zealand service sector.

PSI Time Series Table

The results are seasonally adjusted.

National Indicies May
2018
Jan
2019
Feb
2019
Mar
2019
Apr
2019
May
2019
BNZ – BusinessNZ PSI 56.3 56.4 53.6 52.5 52.0 53.6
Activity/Sales 57.2 61.6 53.3 52.6 51.4 54.7
Employment 52.6 52.6 51.5 51.1 48.4 50.6
New Orders/Business 63.1 60.6 59.1 55.0 55.1 55.7
Stocks/Inventories 53.7 49.8 49.3 49.8 48.5 56.8
Supplier Deliveries 52.9 52.1 50.2 50.9 51.7 51.7

BNZ – BusinessNZ PSI Time Series

May 2015 – May 2019

International Results

J.P. Morgan Global Manufacturing PSITM

05 Jun 2019
51.6

About the PSI

The BNZ – BusinessNZ Performance of Services Index is a monthly survey of the service sector providing an early indicator of activity levels.

A PSI reading above 50 points indicates service activity is expanding; below 50 indicates it is contracting.

The main PSI and sub-index results are seasonally adjusted.

Technical Contact

Stephen Summers
Economist, BusinessNZ

[email protected]

PSI Releases

Lost momentum

New Zealand’s services sector fell back into contraction during March, according to the BNZ – BusinessNZ Performance of Services Index (PSI). The PSI for March was 47.5 (A PSI reading above 50.0 indicates that the service sector is generally expanding; below 50.0 that...

Path of expansion

New Zealand’s services sector continued its path of expansion in February, according to the BNZ – BusinessNZ Performance of Services Index (PSI). The PSI for February was 53.0 (A PSI reading above 50.0 indicates that the service sector is generally expanding; below...

Green shoots?

New Zealand’s services sector climbed back into expansion for the start of 2024, according to the BNZ – BusinessNZ Performance of Services Index (PSI). The PSI for January was 52.1 (A PSI reading above 50.0 indicates that the service sector is generally expanding;...

Activity on holiday

New Zealand’s services sector fell back into contraction during December, according to the BNZ – BusinessNZ Performance of Services Index (PSI). The PSI for December was 48.8 (A PSI reading above 50.0 indicates that the service sector is generally expanding; below...

Over the line

New Zealand’s services sector recorded expansion in November, according to the BNZ – BusinessNZ Performance of Services Index (PSI). The PSI for November was 51.2 (A PSI reading above 50.0 indicates that the service sector is generally expanding; below 50.0 that it is...

BNZ – BusinessNZ
Performance of
Composite Index

53.1

GDP-Weighted Index

51.8

Free-Weighted Index

The seasonally adjusted BNZ – BusinessNZ Performance of Composite Index or PCI (which combines the PMI and PSI) saw the two options for measuring the PCI both improve during May.

The May GDP-Weighted Index (53.1) rose 1.3 points from April, while the Free-Weighted Index (51.8) increased 0.4 points.  A lift in expansion levels for the services sectors meant there was a larger increase in the GDP-Weighted Index.

PCI Time Series Table

The results are seasonally adjusted.

National Indicies May
2018
Jan
2019
Feb
2019
Mar
2019
Apr
2019
May
2019
GDP-Weighted Index 56.0 56.2 53.7 51.9 51.8 53.1
Free-Weighted Index 55.7 55.0 54.1 51.7 51.4 51.8

BNZ – BusinessNZ PCI Time Series

May 2015 – May 2019

About the PCI

The BNZ – BusinessNZ Performance of Composite Index (PCI) takes into account results from both the Performance of Manufacturing Index (PMI) and the Performance of Services Index (PSI). Combined results are shown in two ways:

GDP-Weighted Index:
Apportions the weight of the manufacturing and services index within the economy to produce an overall result.

Free-Weighted Index:
Combines data from both indexes to produce an overall result.

Both time series for the PCI are then seasonally adjusted.

BNZ - BusinessNZ PCI

Time Series Data

View seasonally adjusted and unadjusted time series data for the BNZ - BusinessNZ PCI

Our Contributors

The BNZ – BusinessNZ PSI contains data obtained through BusinessNZ’s regional organisations