BNZ – BusinessNZ
Performance of
Services Index

Break in service – PSI

20 May, 2019
51.8
April
-0.5

Monthly Change

expanding
slower rate

Activity in New Zealand’s services sector slipped further during April, according to the BNZ – BusinessNZ Performance of Services Index (PSI).

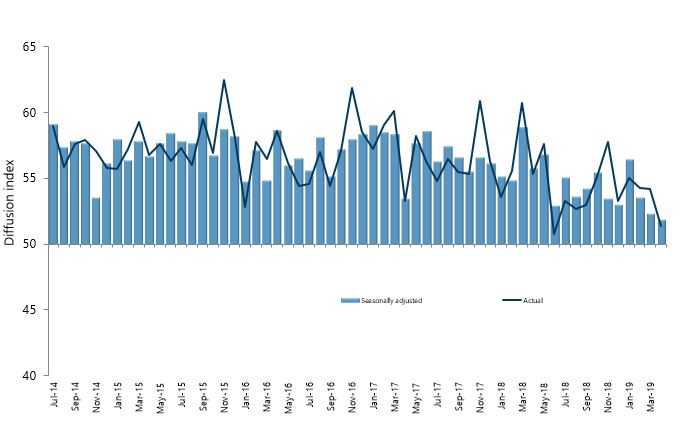
The PSI for April was 51.8, which was 0.5 points down from March, and the third consecutive month-on-month decrease in expansion levels (A PSI reading above 50.0 indicates that the service sector is generally expanding; below 50.0 that it is declining).  The April result was the lowest since September 2012, and below the long term average of 54.4 for the survey.

BusinessNZ chief executive Kirk Hope said that the ongoing decline in expansion is a concern, exacerbated by a few factors during April

“The proportion of positive comments for April (43.9%) decreased significantly from March (55.8%).  The decline was partly due to a number of comments centred on the ANZAC/Easter break disrupting usual business activity.  Others noted a general economic downturn and slowing demand”.

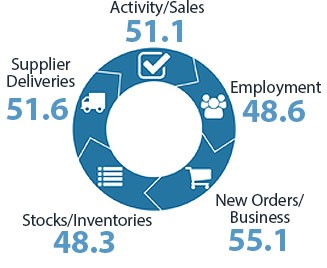
In terms of the sub-index values for April, activity/sales (51.1) was at its lowest point since July 2012, while employment (48.6) dropped to its lowest point since August 2012.  New orders/business (55.1) bucked the trend slightly, increasing marginally from 54.9 in March.

BNZ Senior Economist Craig Ebert said that “unless there is a sizable bounce in May’s PSI, we’ll be left with the distinct impression of a slowing services sector”.

Kirk Hope

Kirk Hope

CEO, BusinessNZ

BNZ - BusinessNZ PSI

Time Series Data

View seasonally adjusted and unadjusted time series data for the BNZ - BusinessNZ PSI

Services Landscape

PSI Strained

New Zealand’s Performance of Services Index (PSI) is starting to struggle. From the 52.3 level it slipped to in March, it eased further in April, to 51.8. This meant the slowest pace since 2012 – whether on a monthly or 3-monthly average basis.
Read more

GDP Growth Dampener

This is all the more significant as the services sector has been the backbone to New Zealand’s economic growth since the 2008/09 recession. So, even with the rebound in April’s Performance of Manufacturing Index, to an ”almost normal” level of 53.0, GDP growth looks prone to toil on the basis of the latest PSI.
Read more

Demand versus Supply

Having said this, we continue to argue that it’s crucial to understand why GDP might be slowing. Is it from a softening of demand, or an exhaustion of supply potential?
Read more

Craig Ebert

Craig Ebert

Senior Economist, BNZ

Sponsor Statement

BNZ is delighted to be associated with the Performance of Services Index (PSI) and BusinessNZ.

This association brings together the significant experience of leading business advocacy body BusinessNZ, and business finance specialist BNZ.

We look forward to continuing our association with BusinessNZ and associated regional organisations, and to playing our part in the ongoing development of the New Zealand service sector.

PSI Time Series Table

The results are seasonally adjusted.

National Indicies Apr
2018
Dec
2018
Jan
2019
Feb
2019
Mar
2019
Apr
2019
BNZ – BusinessNZ PSI 55.7 53.0 56.4 53.5 52.3 51.8
Activity/Sales 56.7 52.2 61.6 53.0 52.3 51.1
Employment 52.0 50.5 52.5 51.7 50.7 48.6
New Orders/Business 60.8 59.4 60.6 59.1 54.9 55.1
Stocks/Inventories 52.2 51.1 49.9 49.2 49.7 48.3
Supplier Deliveries 50.8 51.8 52.0 50.1 50.9 51.6

BNZ – BusinessNZ PSI Time Series

April 2015 – April 2019

International Results

J.P. Morgan Global Manufacturing PSITM

06 May 2019
52.7

About the PSI

The BNZ – BusinessNZ Performance of Services Index is a monthly survey of the service sector providing an early indicator of activity levels.

A PSI reading above 50 points indicates service activity is expanding; below 50 indicates it is contracting.

The main PSI and sub-index results are seasonally adjusted.

Technical Contact

Stephen Summers
Economist, BusinessNZ

[email protected]

PSI Releases

Lost momentum

New Zealand’s services sector fell back into contraction during March, according to the BNZ – BusinessNZ Performance of Services Index (PSI). The PSI for March was 47.5 (A PSI reading above 50.0 indicates that the service sector is generally expanding; below 50.0 that...

Path of expansion

New Zealand’s services sector continued its path of expansion in February, according to the BNZ – BusinessNZ Performance of Services Index (PSI). The PSI for February was 53.0 (A PSI reading above 50.0 indicates that the service sector is generally expanding; below...

Green shoots?

New Zealand’s services sector climbed back into expansion for the start of 2024, according to the BNZ – BusinessNZ Performance of Services Index (PSI). The PSI for January was 52.1 (A PSI reading above 50.0 indicates that the service sector is generally expanding;...

Activity on holiday

New Zealand’s services sector fell back into contraction during December, according to the BNZ – BusinessNZ Performance of Services Index (PSI). The PSI for December was 48.8 (A PSI reading above 50.0 indicates that the service sector is generally expanding; below...

Over the line

New Zealand’s services sector recorded expansion in November, according to the BNZ – BusinessNZ Performance of Services Index (PSI). The PSI for November was 51.2 (A PSI reading above 50.0 indicates that the service sector is generally expanding; below 50.0 that it is...

BNZ – BusinessNZ
Performance of
Composite Index

51.6

GDP-Weighted Index

51.3

Free-Weighted Index

The seasonally adjusted BNZ – BusinessNZ Performance of Composite Index or PCI (which combines the PMI and PSI) saw the two options for measuring the PCI continue their downward path in expansion levels during April.

The April GDP-Weighted Index (51.6) decreased 0.1 points from March, while the Free-Weighted Index (51.3) decreased 0.4 points.  A decrease in expansion levels for both sectors meant there was a continued drop in the two measurements offered.

PCI Time Series Table

The results are seasonally adjusted.

National Indicies Apr
2018
Dec
2018
Jan
2019
Feb
2019
Mar
2019
Apr
2019
GDP-Weighted Index 55.7 53.6 56.1 53.7 51.7 51.6
Free-Weighted Index 56.6 54.9 55.0 54.1 51.7 51.3

BNZ – BusinessNZ PCI Time Series

April 2015 – April 2019

About the PCI

The BNZ – BusinessNZ Performance of Composite Index (PCI) takes into account results from both the Performance of Manufacturing Index (PMI) and the Performance of Services Index (PSI). Combined results are shown in two ways:

GDP-Weighted Index:
Apportions the weight of the manufacturing and services index within the economy to produce an overall result.

Free-Weighted Index:
Combines data from both indexes to produce an overall result.

Both time series for the PCI are then seasonally adjusted.

BNZ - BusinessNZ PCI

Time Series Data

View seasonally adjusted and unadjusted time series data for the BNZ - BusinessNZ PCI

Our Contributors

The BNZ – BusinessNZ PSI contains data obtained through BusinessNZ’s regional organisations