BNZ – BusinessNZ
Performance of
Services Index

Slower pace – PSI

17 Dec, 2018
53.5
November
-1.9

Monthly Change

expanding
slower rate

New Zealand’s services sector experienced a decrease in expansion levels during November, according to the BNZ – BusinessNZ Performance of Services Index (PSI).

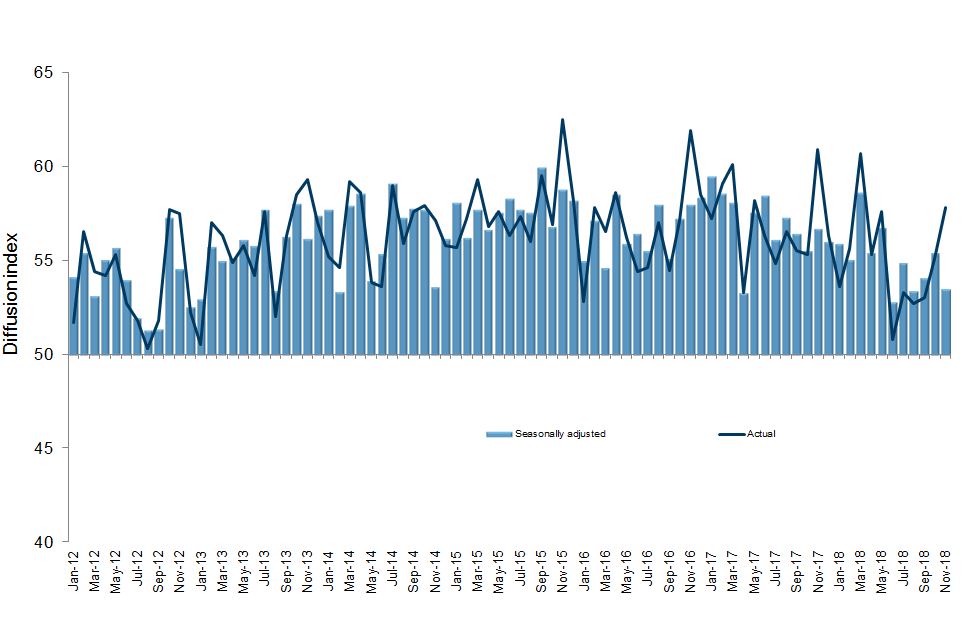
The PSI for November was 53.5, which was 1.9 points lower than October (A PSI reading above 50.0 indicates that the service sector is generally expanding; below 50.0 that it is declining), and a return to levels of expansion last seen in August.  It was also below the long term average of 54.5 for the survey.

BusinessNZ chief executive Kirk Hope said that the lower activity levels was due to a few factors.

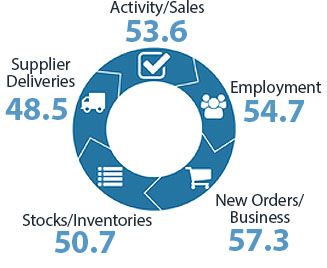
“Although the sub-index of employment (54.7) was at its highest level since December 2017, activity/sales (53.6) returned to levels last experienced in February, while stock/inventories (50.7) dropped back to levels last seen in April 2017.  New orders/business (57.3) still remained in healthy territory, although supplier deliveries (48.5) went into contraction, and the first time one of the sub-indexes produced a negative result for 5 months.

Despite the dip in expansion, the proportion of positive comments in November (60.1%) rose from October (56.5%) and September (50.7%).  Xmas is playing a large part in activity, although there was also a number of comments around the end of year rush to complete projects”. 

BNZ Senior Economist Doug Steel said that “overall, the latest PSI result adds to the evidence that growth in the service sector has settled at a slower pace over the past six months compared to what prevailed previously”.

Kirk Hope

Kirk Hope

CEO, BusinessNZ

BNZ - BusinessNZ PSI

Time Series Data

View seasonally adjusted and unadjusted time series data for the BNZ - BusinessNZ PSI

Services Landscape

Settling Slower

After pushing back above average in October, the Performance of Services Index (PSI) slipped back in November. In numbers, October’s 55.4 and November’s 53.5 oscillated around the series’ long term average of 54.5.
Read more

Details

Slower activity/sales stood out on the softer side in November, with this sub index easing to 53.6 from 57.6 in October. Supplier deliveries were also weak, dipping below the 50 mark that delineates expansion from contraction.
Read more

GDP Implications

When they were released a few months ago, Q2 GDP figures revealed 1.0% growth in the quarter. The much more timely PSI (and PMI) indicators have long been suggesting that growth in the second half of the year has continued albeit slowed from Q2’s pace.
Read more

Employment Bastion

One PSI component showing undeniable strength in November was employment. This lifted to 54.7 adding to its previous strong gain to 53.7 in October, indicating a clear pick up in service sector employment growth has occurred early in the final quarter of the year.
Read more

Doug Steel

Doug Steel

Senior Economist, BNZ

Sponsor Statement

BNZ is delighted to be associated with the Performance of Services Index (PSI) and BusinessNZ.

This association brings together the significant experience of leading business advocacy body BusinessNZ, and business finance specialist BNZ.

We look forward to continuing our association with BusinessNZ and associated regional organisations, and to playing our part in the ongoing development of the New Zealand service sector.

PSI Time Series Table

The results are seasonally adjusted.

National Indicies Nov
2017
Jul
2018
Aug
2018
Sep
2018
Oct
2018
Nov
2018
BNZ – BusinessNZ PSI 56.7 54.9 53.4 54.1 55.4 53.5
Activity/Sales 60.9 57.8 53.9 56.1 57.6 53.6
Employment 49.8 50.2 50.1 50.3 53.7 54.7
New Orders/Business 60.8 59.7 58.6 56.3 58.2 57.3
Stocks/Inventories 59.8 51.0 51.8 53.7 52.1 50.7
Supplier Deliveries 53.9 50.9 52.4 52.1 50.9 48.5

BNZ – BusinessNZ PSI Time Series

November 2014 – November 2018

International Results

J.P. Morgan Global Manufacturing PSITM

06 Dec 2018
53.7

About the PSI

The BNZ – BusinessNZ Performance of Services Index is a monthly survey of the service sector providing an early indicator of activity levels.

A PSI reading above 50 points indicates service activity is expanding; below 50 indicates it is contracting.

The main PSI and sub-index results are seasonally adjusted.

Technical Contact

Stephen Summers
Economist, BusinessNZ

[email protected]

PSI Releases

Lost momentum

New Zealand’s services sector fell back into contraction during March, according to the BNZ – BusinessNZ Performance of Services Index (PSI). The PSI for March was 47.5 (A PSI reading above 50.0 indicates that the service sector is generally expanding; below 50.0 that...

Path of expansion

New Zealand’s services sector continued its path of expansion in February, according to the BNZ – BusinessNZ Performance of Services Index (PSI). The PSI for February was 53.0 (A PSI reading above 50.0 indicates that the service sector is generally expanding; below...

Green shoots?

New Zealand’s services sector climbed back into expansion for the start of 2024, according to the BNZ – BusinessNZ Performance of Services Index (PSI). The PSI for January was 52.1 (A PSI reading above 50.0 indicates that the service sector is generally expanding;...

Activity on holiday

New Zealand’s services sector fell back into contraction during December, according to the BNZ – BusinessNZ Performance of Services Index (PSI). The PSI for December was 48.8 (A PSI reading above 50.0 indicates that the service sector is generally expanding; below...

Over the line

New Zealand’s services sector recorded expansion in November, according to the BNZ – BusinessNZ Performance of Services Index (PSI). The PSI for November was 51.2 (A PSI reading above 50.0 indicates that the service sector is generally expanding; below 50.0 that it is...

BNZ – BusinessNZ
Performance of
Composite Index

53.5

GDP-Weighted Index

53.8

Free-Weighted Index

The seasonally adjusted BNZ – BusinessNZ Performance of Composite Index or PCI (which combines the PMI and PSI) saw the two options for measuring the PCI both decrease from the previous month.

The November GDP-Weighted Index (53.5) decreased 1.7 points from October, while the Free-Weighted Index (53.8) fell 0.9 points.  The fact that the services sector experienced a larger drop in expansion than the manufacturing sector meant the GDP-weighted index saw a larger fall.

PCI Time Series Table

The results are seasonally adjusted.

National Indicies Nov
2017
Jul
2018
Aug
2018
Sep
2018
Oct
2018
Nov
2018
GDP-Weighted Index 56.8 54.5 53.3 53.8 55.2 53.5
Free-Weighted Index 57.5 53.8 53.2 53.2 54.7 53.8

BNZ – BusinessNZ PCI Time Series

November 2014 – November 2018

About the PCI

The BNZ – BusinessNZ Performance of Composite Index (PCI) takes into account results from both the Performance of Manufacturing Index (PMI) and the Performance of Services Index (PSI). Combined results are shown in two ways:

GDP-Weighted Index:
Apportions the weight of the manufacturing and services index within the economy to produce an overall result.

Free-Weighted Index:
Combines data from both indexes to produce an overall result.

Both time series for the PCI are then seasonally adjusted.

BNZ - BusinessNZ PCI

Time Series Data

View seasonally adjusted and unadjusted time series data for the BNZ - BusinessNZ PCI

Our Contributors

The BNZ – BusinessNZ PSI contains data obtained through BusinessNZ’s regional organisations