BNZ – BusinessNZ
Performance of
Services Index

Mixed results – PSI

19 Mar, 2018
55.0
February
-0.7

Monthly Change

expanding
slower rate

New Zealand’s services sector experienced a slight slip in expansion levels during February, according to the BNZ – BusinessNZ Performance of Services Index (PSI).

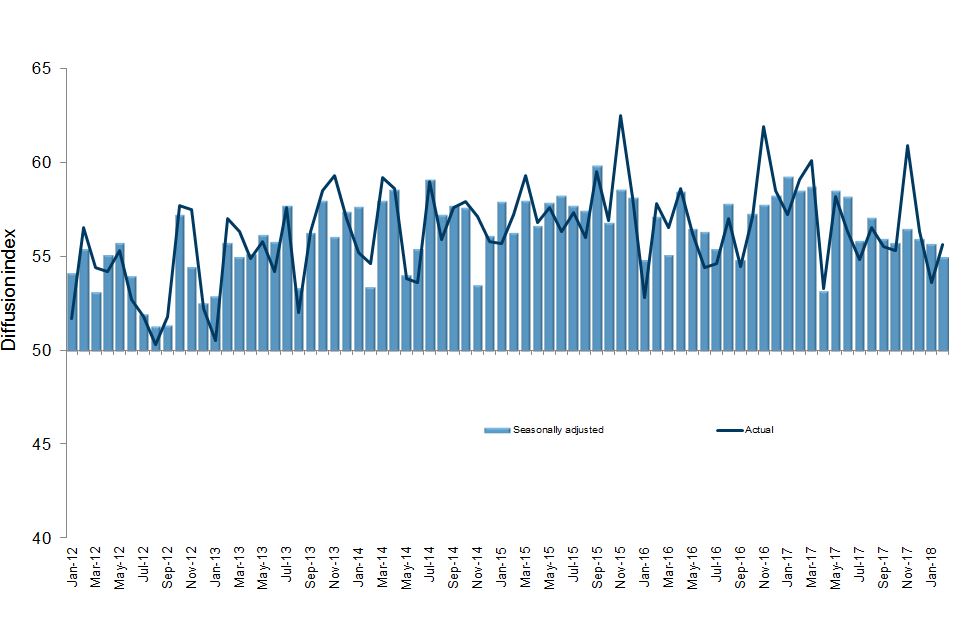
The PSI for February was 55.0, which was 0.7 points lower than January (A PSI reading above 50.0 indicates that the service sector is generally expanding; below 50.0 that it is declining).  It was also the third consecutive decrease in expansion levels.  

BusinessNZ chief executive Kirk Hope said that it is still important to remember that the PSI has been very consistent in terms of expansion levels since September 2017, especially when new orders/business has remained strong.

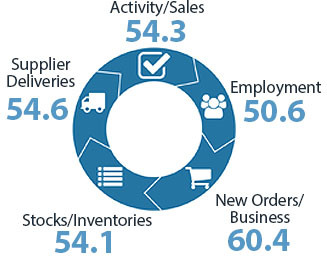
“Comments received from respondents continue to indicate that around 6/10 businesses find their main influence on their business to be positive.  However, a dip in the activity/sale sub-index (54.3) to its lowest value since November 2014 indicates an area that needs to be monitored in the months ahead”.

BNZ Senior Economist Craig Ebert said that “the PSI remains encouragingly expansive, although it has slowed to about average, compared to its roaring rate of advance about this time last year”.

Kirk Hope

Kirk Hope

CEO, BusinessNZ

BNZ - BusinessNZ PSI

Time Series Data

View seasonally adjusted and unadjusted time series data for the BNZ - BusinessNZ PSI

Services Landscape

The PSI

The Performance of Services Index (PSI) remains encouragingly expansive. However, at the same time, it has slowed to about average, compared to its roaring rate of advance about this time last year.
Read more

Services GDP

Even so, the services sector performed strongly in last week’s Q4 2017 GDP accounts – up 1.1% in the quarter. This nudged annual growth in the services sector, GDP wise, up to 3.1%, from 3.0% in Q3. Still, it wasn’t a concerted push – whether in quarter, or annual, growth terms.
Read more

GDP

In fact, we (still) don’t expect a lot of economic growth underfoot. Specifically, we anticipate a 0.6% expansion in Q1 GDP.  The recent PSI readiwngs, along with those of the Performance of Manufacturing Index, certainly counsel against getting carried away.
Read more

Housing

In this context, the next few months’ worth of housing data will be instructive too. We mention this with the property market having shown a bit more life. REINZ home sales, for instance, have rebounded 23%, seasonally adjusted, since a soft spot around election time (September 2017).
Read more

Craig Ebert

Craig Ebert

Senior Economist, BNZ

Sponsor Statement

BNZ is delighted to be associated with the Performance of Services Index (PSI) and BusinessNZ.

This association brings together the significant experience of leading business advocacy body BusinessNZ, and business finance specialist BNZ.

We look forward to continuing our association with BusinessNZ and associated regional organisations, and to playing our part in the ongoing development of the New Zealand service sector.

PSI Time Series Table

The results are seasonally adjusted.

National Indicies Feb
2017
Oct
2017
Nov
2017
Dec
2017
Jan
2018
Feb
2018
BNZ – BusinessNZ PSI 58.5 55.7 56.5 55.9 55.7 55.0
Activity/Sales 61.2 58.1 60.3 58.3 59.3 54.3
Employment 54.6 51.0 50.7 55.8 50.4 50.6
New Orders/Business 61.2 60.1 60.6 60.2 58.5 60.4
Stocks/Inventories 56.3 51.3 58.8 51.3 52.3 54.1
Supplier Deliveries 57.3 53.1 53.4 50.5 54.1 54.6

BNZ – BusinessNZ PSI Time Series

February 2014 – February 2018

International Results

J.P. Morgan Global Manufacturing PSITM

05 Mar 2018
54.8

About the PSI

The BNZ – BusinessNZ Performance of Services Index is a monthly survey of the service sector providing an early indicator of activity levels.

A PSI reading above 50 points indicates service activity is expanding; below 50 indicates it is contracting.

The main PSI and sub-index results are seasonally adjusted.

Technical Contact

Stephen Summers
Economist, BusinessNZ

[email protected]

PSI Releases

Lost momentum

New Zealand’s services sector fell back into contraction during March, according to the BNZ – BusinessNZ Performance of Services Index (PSI). The PSI for March was 47.5 (A PSI reading above 50.0 indicates that the service sector is generally expanding; below 50.0 that...

Path of expansion

New Zealand’s services sector continued its path of expansion in February, according to the BNZ – BusinessNZ Performance of Services Index (PSI). The PSI for February was 53.0 (A PSI reading above 50.0 indicates that the service sector is generally expanding; below...

Green shoots?

New Zealand’s services sector climbed back into expansion for the start of 2024, according to the BNZ – BusinessNZ Performance of Services Index (PSI). The PSI for January was 52.1 (A PSI reading above 50.0 indicates that the service sector is generally expanding;...

Activity on holiday

New Zealand’s services sector fell back into contraction during December, according to the BNZ – BusinessNZ Performance of Services Index (PSI). The PSI for December was 48.8 (A PSI reading above 50.0 indicates that the service sector is generally expanding; below...

Over the line

New Zealand’s services sector recorded expansion in November, according to the BNZ – BusinessNZ Performance of Services Index (PSI). The PSI for November was 51.2 (A PSI reading above 50.0 indicates that the service sector is generally expanding; below 50.0 that it is...

BNZ – BusinessNZ
Performance of
Composite Index

54.8

GDP-Weighted Index

54.4

Free-Weighted Index

The seasonally adjusted BNZ – BusinessNZ Performance of Composite Index or PCI (which combines the PMI and PSI) saw the two options for measuring the PCI both decrease in expansion levels during February.

The February GDP-Weighted Index (54.8) decreased 1.1 points from the previous month, while the Free-Weighted Index (54.4) decreased 0.7 points.

PCI Time Series Table

The results are seasonally adjusted.

National Indicies Feb
2017
Oct
2017
Nov
2017
Dec
2017
Jan
2018
Feb
2018
GDP-Weighted Index 58.1 55.9 56.5 55.4 55.7 54.8
Free-Weighted Index 57.6 56.6 57.4 54.2 55.7 54.4

BNZ – BusinessNZ PCI Time Series

February 2014 – February 2018

About the PCI

The BNZ – BusinessNZ Performance of Composite Index (PCI) takes into account results from both the Performance of Manufacturing Index (PMI) and the Performance of Services Index (PSI). Combined results are shown in two ways:

GDP-Weighted Index:
Apportions the weight of the manufacturing and services index within the economy to produce an overall result.

Free-Weighted Index:
Combines data from both indexes to produce an overall result.

Both time series for the PCI are then seasonally adjusted.

BNZ - BusinessNZ PCI

Time Series Data

View seasonally adjusted and unadjusted time series data for the BNZ - BusinessNZ PCI

Our Contributors

The BNZ – BusinessNZ PSI contains data obtained through BusinessNZ’s regional organisations