BNZ – BusinessNZ
Performance of
Services Index

Lift in service – PSI

16 Apr, 2018
58.8
March
+3.5

Monthly Change

expanding
faster rate

New Zealand’s services sector experienced a lift in expansion levels during March, according to the BNZ – BusinessNZ Performance of Services Index (PSI).

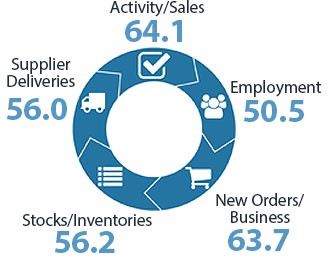
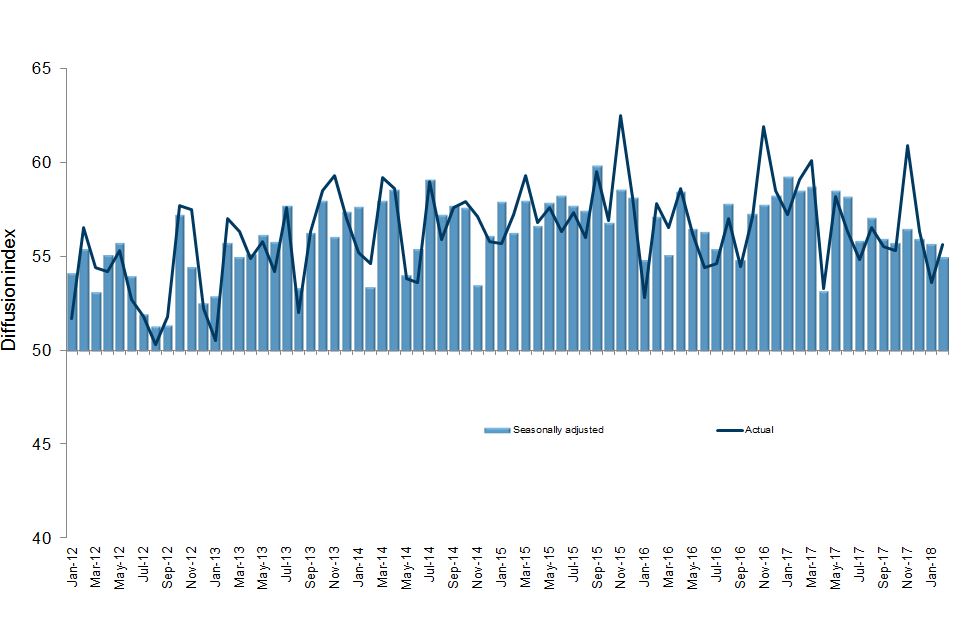
The PSI for March was 58.8, which was 3.5 points higher than February (A PSI reading above 50.0 indicates that the service sector is generally expanding; below 50.0 that it is declining).  This was the highest level of expansion since January 2017, and moved expansion beyond a tight band of activity from September through to February.

BusinessNZ chief executive Kirk Hope said that the key sub-indices of activity/sales (64.1) and new orders/business (63.7) both displayed strong growth, with the former rising 10.7 points from February.

“Given both the PSI and its sister survey the Performance of Manufacturing Index (PMI) has recently shown activity levels down on 2017, the lift in March is welcome”.

BNZ Senior Economist Doug Steel said that “whether its Easter timing, weather influences, or something else, the volatility counsels caution in interpreting current data. It’s definitely possible the March PSI result overstates the underlying trend”.

Kirk Hope

Kirk Hope

CEO, BusinessNZ

BNZ - BusinessNZ PSI

Time Series Data

View seasonally adjusted and unadjusted time series data for the BNZ - BusinessNZ PSI

Services Landscape

Positive service

Service sector activity hopped higher in March. The Performance of Services Index posted a decent lift to 58.8 from 55.3 in February, on a seasonally adjusted basis. Sales activity drove the strength, with this sub index rising to 64.1 – near its highest level since the survey started 11 years ago.
Read more

A break in the weather

Another possible driver is the weather. The PSI sales index dipped to a relatively slow 53.4 in February, seemingly dented by severe adverse weather back then (remember the cyclones). At least some of the March strength is likely a bounce back from a soft February.
Read more

Positives overdone?

Whether its Easter timing, weather influences, or something else, the volatility counsels caution in interpreting current data. It’s definitely possible the March PSI result overstates the underlying trend.
Read more

Growth despite pessimism

Last week’s Quarterly Survey of Business Opinion (QSBO), published by NZIER, showed a net 7% of service sector firms expect general business conditions to deteriorate over the next six months.
Read more

Doug Steel

Doug Steel

Senior Economist, BNZ

Sponsor Statement

BNZ is delighted to be associated with the Performance of Services Index (PSI) and BusinessNZ.

This association brings together the significant experience of leading business advocacy body BusinessNZ, and business finance specialist BNZ.

We look forward to continuing our association with BusinessNZ and associated regional organisations, and to playing our part in the ongoing development of the New Zealand service sector.

PSI Time Series Table

The results are seasonally adjusted.

National Indicies Mar
2017
Nov
2017
Dec
2017
Jan
2018
Feb
2018
Mar
2018
BNZ – BusinessNZ PSI 58.2 56.5 56.0 55.9 55.3 58.8
Activity/Sales 60.3 60.7 58.7 59.8 53.4 64.1
Employment 53.1 50.9 55.9 50.6 50.6 50.5
New Orders/Business 63.6 60.7 60.3 59.6 60.8 63.7
Stocks/Inventories 55.6 58.9 51.5 52.6 54.5 56.2
Supplier Deliveries 55.1 53.5 50.6 54.3 54.8 56.0

BNZ – BusinessNZ PSI Time Series

March 2014 – March 2018

International Results

J.P. Morgan Global Manufacturing PSITM

05 Apr 2018
53.2

About the PSI

The BNZ – BusinessNZ Performance of Services Index is a monthly survey of the service sector providing an early indicator of activity levels.

A PSI reading above 50 points indicates service activity is expanding; below 50 indicates it is contracting.

The main PSI and sub-index results are seasonally adjusted.

Technical Contact

Stephen Summers
Economist, BusinessNZ

[email protected]

PSI Releases

Lost momentum

New Zealand’s services sector fell back into contraction during March, according to the BNZ – BusinessNZ Performance of Services Index (PSI). The PSI for March was 47.5 (A PSI reading above 50.0 indicates that the service sector is generally expanding; below 50.0 that...

Path of expansion

New Zealand’s services sector continued its path of expansion in February, according to the BNZ – BusinessNZ Performance of Services Index (PSI). The PSI for February was 53.0 (A PSI reading above 50.0 indicates that the service sector is generally expanding; below...

Green shoots?

New Zealand’s services sector climbed back into expansion for the start of 2024, according to the BNZ – BusinessNZ Performance of Services Index (PSI). The PSI for January was 52.1 (A PSI reading above 50.0 indicates that the service sector is generally expanding;...

Activity on holiday

New Zealand’s services sector fell back into contraction during December, according to the BNZ – BusinessNZ Performance of Services Index (PSI). The PSI for December was 48.8 (A PSI reading above 50.0 indicates that the service sector is generally expanding; below...

Over the line

New Zealand’s services sector recorded expansion in November, according to the BNZ – BusinessNZ Performance of Services Index (PSI). The PSI for November was 51.2 (A PSI reading above 50.0 indicates that the service sector is generally expanding; below 50.0 that it is...

BNZ – BusinessNZ
Performance of
Composite Index

57.5

GDP-Weighted Index

55.5

Free-Weighted Index

The seasonally adjusted BNZ – BusinessNZ Performance of Composite Index or PCI (which combines the PMI and PSI) saw the two options for measuring the PCI both increase in expansion levels during March.

The March GDP-Weighted Index (57.5) rose 2.5 points from the previous month, while the Free-Weighted Index (55.5) increased 1.0 point.  The higher increase in the former was due to the stronger lift in services sector expansion.

PCI Time Series Table

The results are seasonally adjusted.

National Indicies Mar
2017
Nov
2017
Dec
2017
Jan
2018
Feb
2018
Mar
2018
GDP-Weighted Index 57.8 56.6 55.5 55.8 55.0 57.5
Free-Weighted Index 57.8 57.4 54.1 55.8 54.5 55.5

BNZ – BusinessNZ PCI Time Series

March 2014 – March 2018

About the PCI

The BNZ – BusinessNZ Performance of Composite Index (PCI) takes into account results from both the Performance of Manufacturing Index (PMI) and the Performance of Services Index (PSI). Combined results are shown in two ways:

GDP-Weighted Index:
Apportions the weight of the manufacturing and services index within the economy to produce an overall result.

Free-Weighted Index:
Combines data from both indexes to produce an overall result.

Both time series for the PCI are then seasonally adjusted.

BNZ - BusinessNZ PCI

Time Series Data

View seasonally adjusted and unadjusted time series data for the BNZ - BusinessNZ PCI

Our Contributors

The BNZ – BusinessNZ PSI contains data obtained through BusinessNZ’s regional organisations