BNZ – BusinessNZ
Performance of
Services Index

Lacking service – PSI

17 Sep, 2018
53.2
August
-1.6

Monthly Change

expanding
slower rate

New Zealand’s services sector continued to exhibit lower levels of expansion during August, according to the BNZ – BusinessNZ Performance of Services Index (PSI).

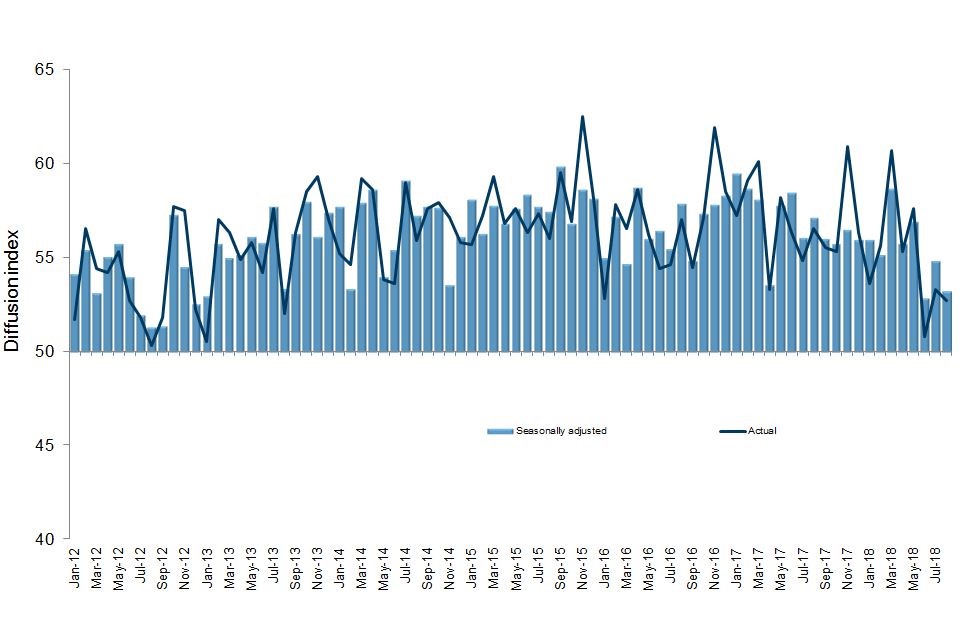
The PSI for August was 53.2, which was 1.6 points lower than July (A PSI reading above 50.0 indicates that the service sector is generally expanding; below 50.0 that it is declining).  This was also below the long run average of 54.5 for the survey.

BusinessNZ chief executive Kirk Hope said that like its sister survey the PMI, the PSI is currently in lower expansion mode.

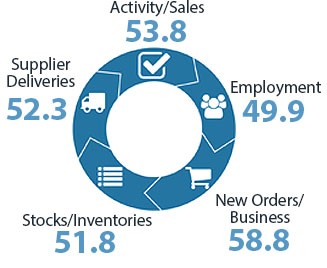
“Looking at the sub-indices, the two key ones involving activity/sales (53.8) and new orders/business (58.8) both decreased in August, with the former at its lowest point since February.  For the third month running, employment (49.9) remains stubbornly stuck on a figure that represents all but no change, while stocks/inventories (51.8) showed some improvement from July.

On a positive note, the proportion of positive comments in August (56.0%) recovered somewhat from the decrease in July (53.8%).” 

BNZ Senior Economist Doug Steel said that “the PSI now sits below its long term average of 54.5. But it is more than one month, the trend has slowed. Indeed, the three month moving average has eased to 53.6, well below last year’s average of 57.1 and its lowest level in more than five years.”.

Kirk Hope

Kirk Hope

CEO, BusinessNZ

BNZ - BusinessNZ PSI

Time Series Data

View seasonally adjusted and unadjusted time series data for the BNZ - BusinessNZ PSI

Services Landscape

Slower Progress

The service sector continues to put one foot in front of the other, but there is a clear sense that the rate of progress has slowed down over recent months. August’s Performance of Services Index (PSI) easing to 53.2 from July’s 54.8 fits this narrative.
Read more

Sales, Orders Mixed; Employment Flat

Despite the generally subdued survey results, there are some positives. New orders remain robust at 58.8, even a whisker above average and still in touch with July’s 60.0 result. It offers some hope for improvement in the current activity/sales index that wilted to a below average 53.8.
Read more

Housing and Retail

Indicators of the housing market and spending have been mixed of late. August’s REINZ housing report, with its varied regional performance, is a case in point. Overall, NZ house sales were 3.1% higher than a year ago, but that is flattered by last year’s softer patch heading into the election.
Read more

Doug Steel

Doug Steel

Senior Economist, BNZ

Sponsor Statement

BNZ is delighted to be associated with the Performance of Services Index (PSI) and BusinessNZ.

This association brings together the significant experience of leading business advocacy body BusinessNZ, and business finance specialist BNZ.

We look forward to continuing our association with BusinessNZ and associated regional organisations, and to playing our part in the ongoing development of the New Zealand service sector.

PSI Time Series Table

The results are seasonally adjusted.

National Indicies Aug
2017
Apr
2018
May
2018
Jun
2018
Jul
2018
Aug
2018
BNZ – BusinessNZ PSI 57.1 55.7 56.9 52.8 54.8 53.2
Activity/Sales 63.3 56.2 57.9 54.7 57.7 53.8
Employment 52.1 51.1 53.1 49.9 49.9 49.9
New Orders/Business 62.6 60.8 64.0 58.5 60.0 58.8
Stocks/Inventories 52.7 51.7 54.3 50.7 51.0 51.8
Supplier Deliveries 51.6 51.0 53.1 48.2 51.0 52.3

BNZ – BusinessNZ PSI Time Series

August 2014 – August 2018

International Results

J.P. Morgan Global Manufacturing PSITM

06 Sep 2018
53.5

About the PSI

The BNZ – BusinessNZ Performance of Services Index is a monthly survey of the service sector providing an early indicator of activity levels.

A PSI reading above 50 points indicates service activity is expanding; below 50 indicates it is contracting.

The main PSI and sub-index results are seasonally adjusted.

Technical Contact

Stephen Summers
Economist, BusinessNZ

[email protected]

PSI Releases

Lost momentum

New Zealand’s services sector fell back into contraction during March, according to the BNZ – BusinessNZ Performance of Services Index (PSI). The PSI for March was 47.5 (A PSI reading above 50.0 indicates that the service sector is generally expanding; below 50.0 that...

Path of expansion

New Zealand’s services sector continued its path of expansion in February, according to the BNZ – BusinessNZ Performance of Services Index (PSI). The PSI for February was 53.0 (A PSI reading above 50.0 indicates that the service sector is generally expanding; below...

Green shoots?

New Zealand’s services sector climbed back into expansion for the start of 2024, according to the BNZ – BusinessNZ Performance of Services Index (PSI). The PSI for January was 52.1 (A PSI reading above 50.0 indicates that the service sector is generally expanding;...

Activity on holiday

New Zealand’s services sector fell back into contraction during December, according to the BNZ – BusinessNZ Performance of Services Index (PSI). The PSI for December was 48.8 (A PSI reading above 50.0 indicates that the service sector is generally expanding; below...

Over the line

New Zealand’s services sector recorded expansion in November, according to the BNZ – BusinessNZ Performance of Services Index (PSI). The PSI for November was 51.2 (A PSI reading above 50.0 indicates that the service sector is generally expanding; below 50.0 that it is...

BNZ – BusinessNZ
Performance of
Composite Index

53.2

GDP-Weighted Index

53.1

Free-Weighted Index

The seasonally adjusted BNZ – BusinessNZ Performance of Composite Index or PCI (which combines the PMI and PSI) saw the two options for measuring the PCI both display lower expansion during August.

The August GDP-Weighted Index (53.2) decreased 1.3 points from July, while the Free-Weighted Index (53.1) fell 0.7 points.  Given both surveys the results come from showed lower expansion in August, the lower levels for both was not unexpected in the current climate.

PCI Time Series Table

The results are seasonally adjusted.

National Indicies Aug
2017
Apr
2018
May
2018
Jun
2018
Jul
2018
Aug
2018
GDP-Weighted Index 57.4 55.7 56.7 52.9 54.5 53.2
Free-Weighted Index 58.0 56.7 56.2 53.3 53.8 53.1

BNZ – BusinessNZ PCI Time Series

August 2014 – August 2018

About the PCI

The BNZ – BusinessNZ Performance of Composite Index (PCI) takes into account results from both the Performance of Manufacturing Index (PMI) and the Performance of Services Index (PSI). Combined results are shown in two ways:

GDP-Weighted Index:
Apportions the weight of the manufacturing and services index within the economy to produce an overall result.

Free-Weighted Index:
Combines data from both indexes to produce an overall result.

Both time series for the PCI are then seasonally adjusted.

BNZ - BusinessNZ PCI

Time Series Data

View seasonally adjusted and unadjusted time series data for the BNZ - BusinessNZ PCI

Our Contributors

The BNZ – BusinessNZ PSI contains data obtained through BusinessNZ’s regional organisations