BNZ – BusinessNZ
Performance of
Services Index

Wait and see – PSI

16 Oct, 2017
56.0
September
-1.2

Monthly Change

expanding
slower rate

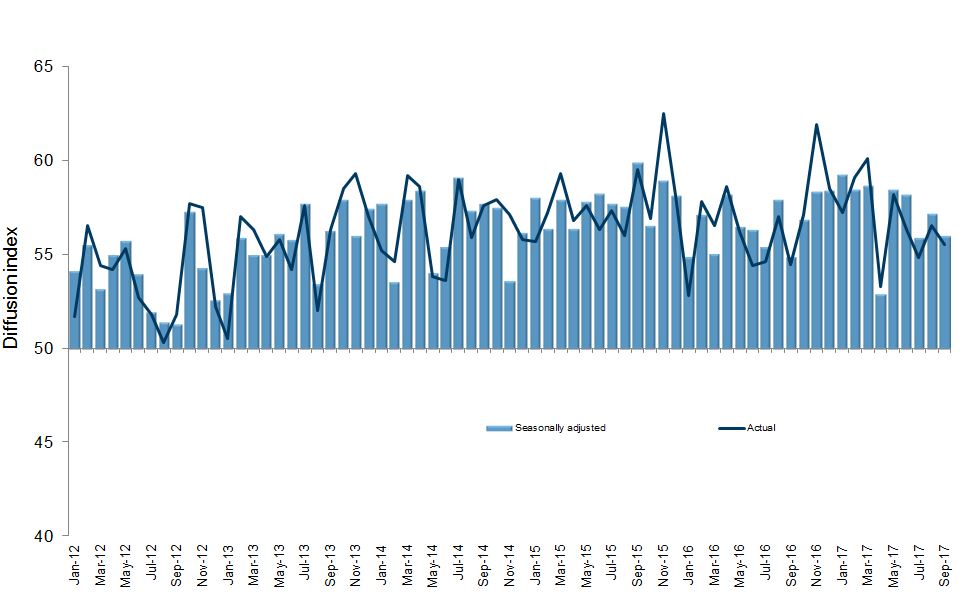
September activity in New Zealand’s services sector returned to overall levels seen in July, according to the BNZ – BusinessNZ Performance of Services Index (PSI).

The PSI for September was 56.0, which was 1.2 points lower than August, but almost identical to the July result of 55.9 (A PSI reading above 50.0 indicates that the service sector is generally expanding; below 50.0 that it is declining).

BusinessNZ chief executive Kirk Hope said that the September value still represented a healthy outcome for the month, with some of the key sub-indices showing lower expansion levels.

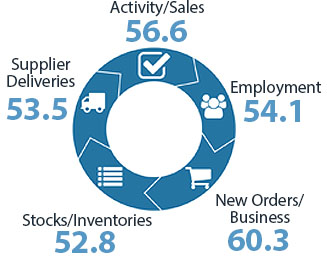
“Both activity/sales (56.6) and new orders/business (60.3) eased in expansion levels, although employment (54.1) and supplier deliveries (53.5) both picked up.  The proportion of positive comments (56.6%) did drop from August, with a higher number of negative comments specifically mentioning uncertainty around the general election”.

BNZ Senior Economist Doug Steel said that “in contrast to measures of business confidence that have noticeably dipped around the election, the PSI, as a survey of changes in actual activity, has held up well”.

Kirk Hope

Kirk Hope

CEO, BusinessNZ

BNZ - BusinessNZ PSI

Time Series Data

View seasonally adjusted and unadjusted time series data for the BNZ - BusinessNZ PSI

Services Landscape

PSI Solid

The Performance of Services Index (PSI) has remained stoutly expansive over recent months. Sure, it cooled marginally to 56.0 in September from 57.2 in August, but it remains well above its long term average of 54.4.
Read more

Election Uncertainties

That is not to say that the election was not on the minds of many PSI respondents. Indeed, just like in the PMI, of the respondents citing the major factor on their business as being a negative one, about a quarter of these noted the election.
Read more

Sales Expansion Slowing?

The PSI activity/sales indicator was one area that did show a material slowdown, although at 56.6 in September it hardly indicates slow growth. Still, it was down from 62.7 in August.
Read more

Service Sector GDP

Recent official figures revealed service sector GDP growth averaged an annual pace of 3.2% in the first half of 2017, above its 5-year average of 2.8%.
Read more

Doug Steel

Doug Steel

Senior Economist, BNZ

Sponsor Statement

BNZ is delighted to be associated with the Performance of Services Index (PSI) and BusinessNZ.

This association brings together the significant experience of leading business advocacy body BusinessNZ, and business finance specialist BNZ.

We look forward to continuing our association with BusinessNZ and associated regional organisations, and to playing our part in the ongoing development of the New Zealand service sector.

PSI Time Series Table

The results are seasonally adjusted.

National Indicies Sep
2016
May
2017
Jun
2017
Jul
2017
Aug
2017
Sep
2017
BNZ – BusinessNZ PSI 54.9 58.4 58.2 55.9 57.2 56.0
Activity/Sales 58.3 62.5 59.1 55.6 62.7 56.6
Employment 51.7 54.1 54.0 55.0 52.2 54.1
New Orders/Business 57.1 62.9 63.8 60.2 63.0 60.3
Stocks/Inventories 53.4 54.4 54.7 52.4 52.8 52.8
Supplier Deliveries 52.1 54.8 56.5 52.2 52.8 53.5

BNZ – BusinessNZ PSI Time Series

September 2013 – September 2017

International Results

J.P. Morgan Global Manufacturing PSITM

04 Oct 2017
54.0

About the PSI

The BNZ – BusinessNZ Performance of Services Index is a monthly survey of the service sector providing an early indicator of activity levels.

A PSI reading above 50 points indicates service activity is expanding; below 50 indicates it is contracting.

The main PSI and sub-index results are seasonally adjusted.

Technical Contact

Stephen Summers
Economist, BusinessNZ

[email protected]

PSI Releases

Lost momentum

New Zealand’s services sector fell back into contraction during March, according to the BNZ – BusinessNZ Performance of Services Index (PSI). The PSI for March was 47.5 (A PSI reading above 50.0 indicates that the service sector is generally expanding; below 50.0 that...

Path of expansion

New Zealand’s services sector continued its path of expansion in February, according to the BNZ – BusinessNZ Performance of Services Index (PSI). The PSI for February was 53.0 (A PSI reading above 50.0 indicates that the service sector is generally expanding; below...

Green shoots?

New Zealand’s services sector climbed back into expansion for the start of 2024, according to the BNZ – BusinessNZ Performance of Services Index (PSI). The PSI for January was 52.1 (A PSI reading above 50.0 indicates that the service sector is generally expanding;...

Activity on holiday

New Zealand’s services sector fell back into contraction during December, according to the BNZ – BusinessNZ Performance of Services Index (PSI). The PSI for December was 48.8 (A PSI reading above 50.0 indicates that the service sector is generally expanding; below...

Over the line

New Zealand’s services sector recorded expansion in November, according to the BNZ – BusinessNZ Performance of Services Index (PSI). The PSI for November was 51.2 (A PSI reading above 50.0 indicates that the service sector is generally expanding; below 50.0 that it is...

BNZ – BusinessNZ
Performance of
Composite Index

56.1

GDP-Weighted Index

56.8

Free-Weighted Index

The seasonally adjusted BNZ – BusinessNZ Performance of Composite Index or PCI (which combines the PMI and PSI) saw the two options for measuring the PCI both showing a dip in expansion during September.

The September GDP-Weighted Index (56.1) decreased 1.2 points from August, while the Free-Weighted Index (56.8) dropped 1.1 points.  The decrease in expansion levels for both the manufacturing and services sector led to both measures showing lower expansion levels during September.

PCI Time Series Table

The results are seasonally adjusted.

National Indicies Sep
2016
May
2017
Jun
2017
Jul
2017
Aug
2017
Sep
2017
GDP-Weighted Index 55.0 58.4 57.8 55.9 57.3 56.1
Free-Weighted Index 56.4 59.0 57.4 56.2 57.9 56.8

BNZ – BusinessNZ PCI Time Series

September 2013 – September 2017

About the PCI

The BNZ – BusinessNZ Performance of Composite Index (PCI) takes into account results from both the Performance of Manufacturing Index (PMI) and the Performance of Services Index (PSI). Combined results are shown in two ways:

GDP-Weighted Index:
Apportions the weight of the manufacturing and services index within the economy to produce an overall result.

Free-Weighted Index:
Combines data from both indexes to produce an overall result.

Both time series for the PCI are then seasonally adjusted.

BNZ - BusinessNZ PCI

Time Series Data

View seasonally adjusted and unadjusted time series data for the BNZ - BusinessNZ PCI

Our Contributors

The BNZ – BusinessNZ PSI contains data obtained through BusinessNZ’s regional organisations