BNZ – BusinessNZ
Performance of
Services Index

Stable services – PSI

20 Mar, 2017
58.8
February
-0.7

Monthly Change

expanding
slower rate

New Zealand’s services sector remains at a stable and solid level of expansion, according to the BNZ – BusinessNZ Performance of Services Index (PSI).
 
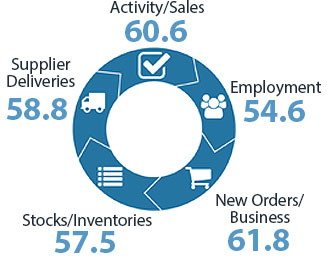
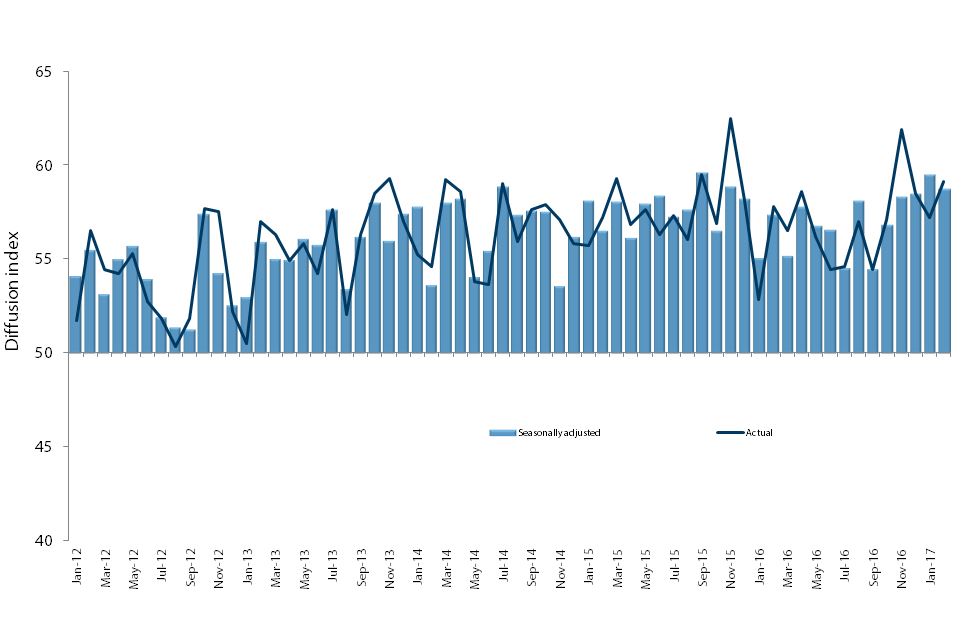
The PSI for February was 58.8.  Although this was 0.7 points lower than January, it was still the second highest level of expansion since November 2015 (A PSI reading above 50.0 indicates that the service sector is generally expanding; below 50.0 that it is declining).
 
BusinessNZ chief executive Kirk Hope said that the services sector has remained in a consistent and positive level of expansion for the last four months.

“What’s continued to drive solid expansion levels has been in no small part due to the sub-indices of activity/sales and new orders/business remaining over the 60-point mark”.
 
BNZ Senior Economist Doug Steel said “with minimal movement over recent months, and even not all much change of the past four years, it might have some wondering if the PSI is telling us anything at all.  In fact, we think it is quite revealing in that the PSI is growing at a strong and steady pace”.

Kirk Hope

Kirk Hope

CEO, BusinessNZ

BNZ - BusinessNZ PSI

Time Series Data

View seasonally adjusted and unadjusted time series data for the BNZ - BusinessNZ PSI

Services Landscape

Steady Strong Service

New Zealand’s Performance of Services Index (PSI) remains very strong. February’s 58.8 result is little changed from January’s 59.5. Indeed, the PSI has remained in a tight 58.3 to 59.5 range over the past four months.
Read more

Good For Growth

Ongoing PSI strength in January and February bodes well for GDP growth ahead. So too the bounce in the Performance of Manufacturing Index (PMI) for February published last Friday.
Read more

Sales and Orders

The PSI details support the headline positivity, with broadbased strength. The sales and new orders components continue to lead the charge – both posting their fourth consecutive month above the 60 mark.
Read more

Houses and Building

Despite the widespread near term positive growth signals above, we are alert to some other indicators cooling over recent months.
Read more

Doug Steel

Doug Steel

Senior Economist, BNZ

Sponsor Statement

BNZ is delighted to be associated with the Performance of Services Index (PSI) and BusinessNZ.

This association brings together the significant experience of leading business advocacy body BusinessNZ, and business finance specialist BNZ.

We look forward to continuing our association with BusinessNZ and associated regional organisations, and to playing our part in the ongoing development of the New Zealand service sector.

PSI Time Series Table

The results are seasonally adjusted.

National Indicies Feb
2016
Oct
2016
Nov
2016
Dec
2016
Jan
2017
Feb
2017
BNZ – BusinessNZ PSI 57.4 56.8 58.3 58.5 59.5 58.8
Activity/Sales 60.2 59.1 64.6 63.2 60.7 60.6
Employment 53.7 54.7 52.4 54.1 53.7 54.6
New Orders/Business 62.2 58.0 62.2 61.3 64.0 61.8
Stocks/Inventories 53.8 54.2 52.5 53.2 57.4 57.5
Supplier Deliveries 53.7 55.0 56.4 57.0 57.1 58.8

BNZ – BusinessNZ PSI Time Series

February 2013 – February 2017

International Results

J.P. Morgan Global Manufacturing PSITM

03 Mar 2017
53.3

About the PSI

The BNZ – BusinessNZ Performance of Services Index is a monthly survey of the service sector providing an early indicator of activity levels.

A PSI reading above 50 points indicates service activity is expanding; below 50 indicates it is contracting.

The main PSI and sub-index results are seasonally adjusted.

Technical Contact

Stephen Summers
Economist, BusinessNZ

[email protected]

PSI Releases

Lost momentum

New Zealand’s services sector fell back into contraction during March, according to the BNZ – BusinessNZ Performance of Services Index (PSI). The PSI for March was 47.5 (A PSI reading above 50.0 indicates that the service sector is generally expanding; below 50.0 that...

Path of expansion

New Zealand’s services sector continued its path of expansion in February, according to the BNZ – BusinessNZ Performance of Services Index (PSI). The PSI for February was 53.0 (A PSI reading above 50.0 indicates that the service sector is generally expanding; below...

Green shoots?

New Zealand’s services sector climbed back into expansion for the start of 2024, according to the BNZ – BusinessNZ Performance of Services Index (PSI). The PSI for January was 52.1 (A PSI reading above 50.0 indicates that the service sector is generally expanding;...

Activity on holiday

New Zealand’s services sector fell back into contraction during December, according to the BNZ – BusinessNZ Performance of Services Index (PSI). The PSI for December was 48.8 (A PSI reading above 50.0 indicates that the service sector is generally expanding; below...

Over the line

New Zealand’s services sector recorded expansion in November, according to the BNZ – BusinessNZ Performance of Services Index (PSI). The PSI for November was 51.2 (A PSI reading above 50.0 indicates that the service sector is generally expanding; below 50.0 that it is...

BNZ – BusinessNZ
Performance of
Composite Index

58.3

GDP-Weighted Index

57.4

Free-Weighted Index

The seasonally adjusted BNZ – BusinessNZ Performance of Composite Index or PCI (which combines the PMI and PSI) saw the two options for measuring the PCI showing contrasting results.

The February GDP-Weighted Index (58.3) decreased 0.4 points from January, while the Free-Weighted Index (57.4) rose 0.6 points.  The pick up in the Free-Weighted Index was mainly due to the lift in manufacturing activity.

PCI Time Series Table

The results are seasonally adjusted.

National Indicies Feb
2016
Oct
2016
Nov
2016
Dec
2016
Jan
2017
Feb
2017
GDP-Weighted Index 57.0 56.6 57.5 58.0 58.7 58.3
Free-Weighted Index 56.8 55.7 56.5 56.5 56.8 57.4

BNZ – BusinessNZ PCI Time Series

February 2013 – February 2017

About the PCI

The BNZ – BusinessNZ Performance of Composite Index (PCI) takes into account results from both the Performance of Manufacturing Index (PMI) and the Performance of Services Index (PSI). Combined results are shown in two ways:

GDP-Weighted Index:
Apportions the weight of the manufacturing and services index within the economy to produce an overall result.

Free-Weighted Index:
Combines data from both indexes to produce an overall result.

Both time series for the PCI are then seasonally adjusted.

BNZ - BusinessNZ PCI

Time Series Data

View seasonally adjusted and unadjusted time series data for the BNZ - BusinessNZ PCI

Our Contributors

The BNZ – BusinessNZ PSI contains data obtained through BusinessNZ’s regional organisations