BNZ – BusinessNZ
Performance of
Services Index

Stepping up – PSI

19 Apr, 2017
59.0
March
+0.3

Monthly Change

expanding
faster rate

New Zealand’s services sector continued to show increased expansion during March, according to the BNZ – BusinessNZ Performance of Services Index (PSI).
 
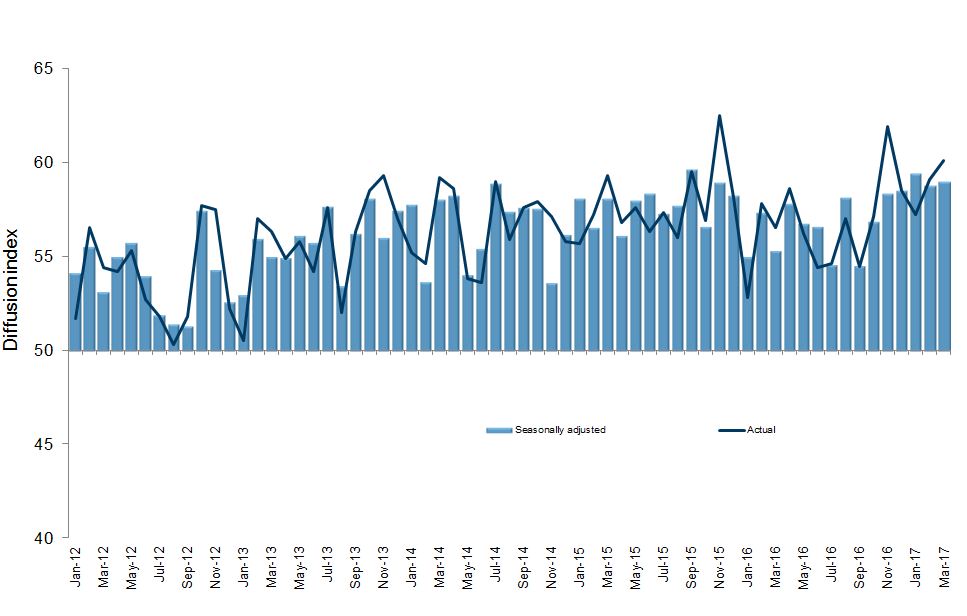
The PSI for March was 59.0.  This was 0.3 points higher than February, and the second highest level of expansion over the last 18 months (A PSI reading above 50.0 indicates that the service sector is generally expanding; below 50.0 that it is declining).
 
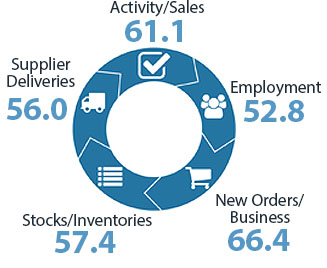
BusinessNZ chief executive Kirk Hope said that the strong result shown for the new orders/business sub-index contributed towards the higher March figure.

“New orders/business (66.4) were at its highest level since June 2007, which should feed through to activity/sales in the months ahead.  Combined with 65.6% of respondents providing positive comments, the sector is currently in a solid and positive place”.
 
BNZ Senior Economist Doug Steel said that “the PSI has been a bit like a stuck record, set on high volume. In fact, the volume dial is even getting tweaked up a bit more”.

Kirk Hope

Kirk Hope

CEO, BusinessNZ

BNZ - BusinessNZ PSI

Time Series Data

View seasonally adjusted and unadjusted time series data for the BNZ - BusinessNZ PSI

Services Landscape

Stuck Strong

New Zealand’s Performance of Services Index (PSI) has been persistently strong over the past few months. It’s been a bit like a stuck record, set on high volume. In fact, the volume dial is even getting tweaked up a bit more.
Read more

Difficult Finding Help

Interestingly, employment was one of the relatively weaker components of the PSI. We say ‘relatively’ because, at 52.8, it still implies reasonable employment growth.
Read more

Spending Up

The unadjusted PSI for retail trade punched up to 63.0 in March, well above its average for this time of year. Electronic card transaction data supports the buoyant demand story.
Read more

Housing

The 8,504 house sales in March were 10.7% down on a year earlier. No surprise then to see spending on durable goods as one of the weaker categories in the electronic transactions data over the past year.
Read more

Doug Steel

Doug Steel

Senior Economist, BNZ

Sponsor Statement

BNZ is delighted to be associated with the Performance of Services Index (PSI) and BusinessNZ.

This association brings together the significant experience of leading business advocacy body BusinessNZ, and business finance specialist BNZ.

We look forward to continuing our association with BusinessNZ and associated regional organisations, and to playing our part in the ongoing development of the New Zealand service sector.

PSI Time Series Table

The results are seasonally adjusted.

National Indicies Mar
2016
Nov
2016
Dec
2016
Jan
2017
Feb
2017
Mar
2017
BNZ – BusinessNZ PSI 55.3 58.4 58.5 59.4 58.7 59.0
Activity/Sales 59.8 64.6 63.2 60.6 60.6 61.1
Employment 53.4 52.3 54.4 53.3 54.7 52.8
New Orders/Business 57.1 62.2 61.3 64.2 62.0 66.4
Stocks/Inventories 52.4 52.5 53.3 57.5 57.7 57.4
Supplier Deliveries 52.2 56.4 57.0 57.0 58.6 56.0

BNZ – BusinessNZ PSI Time Series

March 2013 – March 2017

International Results

J.P. Morgan Global Manufacturing PSITM

05 Apr 2017
53.6

About the PSI

The BNZ – BusinessNZ Performance of Services Index is a monthly survey of the service sector providing an early indicator of activity levels.

A PSI reading above 50 points indicates service activity is expanding; below 50 indicates it is contracting.

The main PSI and sub-index results are seasonally adjusted.

Technical Contact

Stephen Summers
Economist, BusinessNZ

[email protected]

PSI Releases

Path of expansion

New Zealand’s services sector continued its path of expansion in February, according to the BNZ – BusinessNZ Performance of Services Index (PSI). The PSI for February was 53.0 (A PSI reading above 50.0 indicates that the service sector is generally expanding; below...

Green shoots?

New Zealand’s services sector climbed back into expansion for the start of 2024, according to the BNZ – BusinessNZ Performance of Services Index (PSI). The PSI for January was 52.1 (A PSI reading above 50.0 indicates that the service sector is generally expanding;...

Activity on holiday

New Zealand’s services sector fell back into contraction during December, according to the BNZ – BusinessNZ Performance of Services Index (PSI). The PSI for December was 48.8 (A PSI reading above 50.0 indicates that the service sector is generally expanding; below...

Over the line

New Zealand’s services sector recorded expansion in November, according to the BNZ – BusinessNZ Performance of Services Index (PSI). The PSI for November was 51.2 (A PSI reading above 50.0 indicates that the service sector is generally expanding; below 50.0 that it is...

Lost momentum

New Zealand’s services sector went back into contraction in October, according to the BNZ – BusinessNZ Performance of Services Index (PSI). The PSI for October was 48.9 (A PSI reading above 50.0 indicates that the service sector is generally expanding; below 50.0 that...

BNZ – BusinessNZ
Performance of
Composite Index

59.0

GDP-Weighted Index

58.7

Free-Weighted Index

The seasonally adjusted BNZ – BusinessNZ Performance of Composite Index or PCI (which combines the PMI and PSI) saw the two options for measuring the PCI both increase in March.
 
The March GDP-Weighted Index (59.0) increased 0.8 points from February, while the Free-Weighted Index (58.7) rose 1.1 points.  The pick up in both indices was due to a combined lift in activity across both the manufacturing and services sectors.

PCI Time Series Table

The results are seasonally adjusted.

National Indicies Mar
2016
Nov
2016
Dec
2016
Jan
2017
Feb
2017
Mar
2017
GDP-Weighted Index 55.2 57.5 58.0 58.7 58.2 59.0
Free-Weighted Index 54.5 56.6 56.6 56.9 57.6 58.7

BNZ – BusinessNZ PCI Time Series

March 2013 – March 2017

About the PCI

The BNZ – BusinessNZ Performance of Composite Index (PCI) takes into account results from both the Performance of Manufacturing Index (PMI) and the Performance of Services Index (PSI). Combined results are shown in two ways:

GDP-Weighted Index:
Apportions the weight of the manufacturing and services index within the economy to produce an overall result.

Free-Weighted Index:
Combines data from both indexes to produce an overall result.

Both time series for the PCI are then seasonally adjusted.

BNZ - BusinessNZ PCI

Time Series Data

View seasonally adjusted and unadjusted time series data for the BNZ - BusinessNZ PCI

Our Contributors

The BNZ – BusinessNZ PSI contains data obtained through BusinessNZ’s regional organisations